Feature #11423
implement centralized status/error tracking for conversion/dev tools
100%
Related issues
History
#1 Updated by Greg Shah 6 months ago
- Related to Feature #7180: create a centralized manager for the conversion list and per-file/project status and logging added
#2 Updated by Greg Shah 6 months ago
- Related to Feature #3882: changes to allow the front-end to be used for 4GL syntax checking added
#3 Updated by Greg Shah 6 months ago
- Related to Feature #11355: VSCode extension added
#4 Updated by Greg Shah 6 months ago
- Subject changed from implement centralized status/error tracking to implement centralized status/error tracking for conversion/dev tools
Current State
Our current approach to error handling is we write something to STDOUT or a log when a problem is detected. Sometimes we abort, sometimes not. That is basically it. You can't tell status without analyzing the logs. You don't get any feedback on how complete any given job is.
This is not OK.
Objectives
Create a central service which tracks:
- Problems
- Whenever something adverse occurs, it gets reported to the central service instead of being output to log.
- We will standardize what is reported. This includes:
- descriptions
- error codes
- severity levels
- source code file and location (needs #3881)
- profile
- thread
- Querying
- At any time while a tool is running (e.g. a conversion job), the current list should be queryable.
- The list should be available by different views:
- Scope
- By Artifact
- By Directory
- By Profile
- By Project
- Severity Level
- Problem Type/Description/Error Code
- Scope
- Status
- Each job being processed should record centralized status as it runs.
- This would include things like:
- Phase is being processed (e.g. annotations, core conversion).
- Current profile, file being processed.
- Rough % complete.
How We Will Use This
After this is implemented, I would expect that we would:
- Rework Tools
- Command line tools like
ConversionDrivershould not output logs by default, but instead should be reworked to provide a high level status as it processes and output a detailed error summary at the end. - The #3882 syntax checker would be implemented based on our front end conversion and this error/status tracker.
- The #11355 IDE support would use this to drive the LSP "diagnostics".
- Command line tools like
- Standardized configurable options should be provided for how we respond to errors. In particular, do we abort when we see a problem of a specific level?
- When the job is full complete, we should be able to report an overall success/failure.
#5 Updated by Radu Apetrii 2 months ago
- File 11423_full.webm added
- File 11423_silent.webm added
I did a bit of work for this task in the area of progress tracking.
As a short backstory, while working on testing some other branches, it happened that my laptop froze a couple of times. And because there are some places in the conversion where you simply have to look at the screen and wait for something to happen, I became paranoid: is the process still going or did the laptop freeze again? For instance, the compile phase only tells you something like "Compiling x classes ...", but you have no idea if there's actually progress being made. Plus, if there are lots of messages being shown on screen, it is sometimes difficult to tell which phase the conversion is at at the moment. So I basically wanted to have something that tells me what's currently happening, and Greg reminded me of this task, which goes hand in hand with what I wanted to do.
So, to show what I added, I prepared two demos with conversions on the hotel_gui project.11423_full.webmwhich shows the conversion as it is now, but there's a tracker/bar/row at the bottom of the terminal that updates based on the conversion progress. So basically you want to keep your eyes on the bottom row of the terminal, because that's the thing that's new from the regular process.- Recommendation: start with this video, so you don't freak out when you see the next one.
- Sorry for the low fps, I had to adjust that a little to make the video fit in Redmine's threshold. I believe the content is still legible, but if needed I can upload the original version somewhere.
11423_silent.webmwhich is similar to how the-qargument often works in commands.- It basically suppresses the conversion logs and shows only the progress bar/tracker/row (whatever you want to call it).
- This is honestly my personal favorite because I can see clearly what's going on without having the entire conversion displayed in front of my eyes.
- I made sure that stuff still gets put into the cvt log file even if it's not displayed on the screen. So we don't lose any information even when going down this path.
To switch between the two modes you have to modify a node in the build.xml of a project. At the moment, if the node has true as a value, it displays the full logs, and if it has false it proceeds with the silent mode. I created branch 11423a, but I didn't commit the changes yet, as there are a couple of things still left to do: add javadocs + history entries, investigate a few scenarios, rechecking that everything looks good.
- The cvt log file is very slightly different in the two modes.
- In the silent mode, it matches exactly the trunk version.
- In the full mode, the content is still the same, but there's a line being added after each completed phase. It is something like
[Phase 1/15] Parse Progress Sources 62/62 (100%)which basically shows that this phase completed successfully. I don't think it's harmful and it definitely doesn't interfere with the other stuff, but I haven't figured out yet why this only happens in this mode.
- You may spot an error in a file in the video with the 'full' keyword. That happens with trunk as well, and whilst I know it needs fixing, I'm somewhat glad it's not from my changes. Despite that error, the conversion is still reported as successful even with trunk.
- As some would say, necessity is the mother of invention. So, I noticed that in the silent mode, the text from the compile phase saying "Compiling x classes ..." and the entire text for the deploy.prepare target were missing from the terminal. The processes were still performed normally, but the text simply didn't appear on screen. And since I couldn't figure out why, I added another node in
build.xmlwhere you can specify targets that you want to see on the screen no matter what.- This makes the silent mode practically customizable. By default the displayed information is what I presented in the video, but let's say you want to see what's happening in the
convert.fronttarget, and don't care about the rest. Well, you would addconvert.frontin that node, and you'll see the full logs for those processes, while keeping the rest silent. - I know I still need to look into the original issue, i.e. why deploy.prepare doesn't show on screen, but I think this is something to keep in mind, maybe we decide to keep the functionality.
- This makes the silent mode practically customizable. By default the displayed information is what I presented in the video, but let's say you want to see what's happening in the
- If you pay attention at the number of phases throughout the videos, you'll see something like
[Phase 1/15]in the beginning, but later on it becomes something like[Phase 27/28].- I think I can't compute with exactitude the total number of phases the conversion will have right from the start (with accent on "I think"). I believe some are decided mid-run, and are guarded by ifs.
- So, what I did was count the things I was certain are getting executed (in this case 15), and start the counting with that number. And throughout the conversion, I increase the total number of phases if I reach a case that wasn't counted initially. I don't really like this since I basically hardcoded
15, but I did it just to see that it works for now. - I plan to do a bit more thinking on this matter. One idea was to have something like a simulation before the actual conversion. Like have an extra step before, that goes through the code with 0 files just to see what gets executed. And while this is happening, the terminal would display something like
Determining the number of phases .... Having the correct number right from the start is interesting to me, but I don't know if it's worth going through all the trouble for something that gets corrected mid-run anyway.
- Probably the biggest thing to note is that I made a lot of changes. Well, actually, I added a lot of things; the things that were changed are not that many. But still, once I solve the items that are still left to do, be prepared for a lot of reviewing.
Finally, if there's anything, absolutely anything that needs changing, please provide some feedback. I initially built the Java compile progress bar to satisfy my paranoia without even knowing if somebody else is going to use it, but here we are now, with a massive set of changes in our ('my' at the moment) hands.
#6 Updated by Radu Apetrii 2 months ago
- I only tested a conversion that works (both full and incremental), but I have no idea what happens if something interrupts the entire process with an error, i.e. having an error that stops the conversion entirely. That is something I will look into.
- Also, I only tested Hotel. It will be interesting to see this in a customer application scenario.
- Right now, if you don't set the things up in
build.xml, the program gets pretty angry and refuses to run anything. I will look to default to the normal conversion if nothing is set up. - In terms of performance, I haven't seen any problems. All the conversions that I did (silent, full, original trunk) complete in [2m55s,3m00s]. I will look and see it this affects a customer application, but I don't really expect to.
#7 Updated by Constantin Asofiei 2 months ago
Radu, javac has plugin support with notifications on what it is doing. This maybe can be used to provide information about the number of compiled classes.
#8 Updated by Radu Apetrii 2 months ago
Constantin Asofiei wrote:
Radu, javac has plugin support with notifications on what it is doing. This maybe can be used to provide information about the number of compiled classes.
I'll take a look, thank you.
My version of javac progress tracker is fairly primitive, but it works. You can see in the videos the row that says e.g.Compiling 6/62 (9%) and gets updated until it reaches 100%. What I did was:
- Created a listener that (shockingly) listens on Ant's message bus. The party starts when it identifies the
Compiling <N> source files to <DIR>.- This marks not only the start of the phase, but also the directory where the classes will be, and the total number of classes to be generated.
- The first thing to do is to create a baseline by counting how many class files are already in the directory. Two reasons for this:
- Javac has two phases, and both generate the class files in the same directory. Without a baseline, the second operation would show inaccurate results right from the start.
- For incremental conversion, there are classes in the directory already. So it wouldn't be right to recount them again since they won't get recompiled.
- Then, every max(1s, 20 x walk duration), count the number of classes in the directory, compute the delta, and show the result on screen.
- I put that 20 x walk duration guard so that a project with a lot of classes to compile doesn't slow down just to show a very accurate result. I'll consider this experimental for now, because I haven't tested a large customer application yet. I might change this entirely after a round of testing.
Still, the conclusion is that I will look into that plugin support, maybe it makes the situation easier right from the start.
#9 Updated by Greg Shah 2 months ago
We should not depend on ant for this solution. ant is just one way that a project can be setup. It is optional and can be replaced with something like gradle or maven or even just not used at all (someone can just write scripts to invoke our tools like ConversionDriver.
Our IDE support will likely be implementing this directly, as an example.
#10 Updated by Radu Apetrii 2 months ago
Greg Shah wrote:
We should not depend on ant for this solution.
antis just one way that a project can be setup. It is optional and can be replaced with something likegradleormavenor even just not used at all (someone can just write scripts to invoke our tools likeConversionDriver.
That's actually fine I think. I looked a bit into the plugin that Constantin suggested, and that doesn't require ant stuff. More than that, for the classes, it shows both parsing and compiling progress, and the update happens with more accuracy than what I did. So I'm looking to accommodate this suggestion into the solution.
#12 Updated by Hynek Cihlar 2 months ago
How is the content rendered when the output is redirected to a file? Also it would be useful to see errors output even in the silence mode. When there are errors typically you want to know what failed.
#13 Updated by Greg Shah about 2 months ago
Here are some notes on the design of the main solution for this task. Radu: this isn't for you, Paula will be implementing this.
- Since the LSP refers to this kind of data as diagnostics AND since the world has too many
ErrorManagerclasses, we will call the main class that manages this data theDiagnosticsManager(DM). - The
DMwill manage a collection ofDiagnosticsRecordinstances. - Each
DiagnosticsRecordwill store all the data needed to represent a particular item of note, no matter the severity. This will include details like the location of the problem, the priority level of the issue as well as the details of the problem/error/failure/warning... being reported. - We will make provisions for the idea that different programmatic users will need to view this collection in different ways. Examples:
- View the list of errors, sorted by the priority level and then by the order in which the error was encountered in the conversion run.
- View the list of warnings for the current compilation unit.
- View all fatal priority records, sorted by record type.
- It is not clear to me if we need to maintain some kind of versioning so that the collection of issues for multiple runs can be managed.
#14 Updated by Greg Shah about 2 months ago
- Assignee set to Paula Păstrăguș
#15 Updated by Paula Păstrăguș about 2 months ago
I will create branch 11423b to handle the implementation for #11423-13. I'll leave the a version for Radu so he can wrap up the remaining tasks on his implementation.
#16 Updated by Paula Păstrăguș about 2 months ago
Diagnostics infrastructure was committed as rev 16719 (11423b).
Here's what I've done:
Implementation
New package com.goldencode.p2j.diagnostic
Lifecycle
For now, there is no versioning. A manager belongs to exactly one run: created by the driver, made current through DiagnosticsContext, discarded when the run ends.
Expected problems vs. internal failures
Two marker interfaces: Diagnosable (a defect in the input) and InternalFailure (a defect in FWD). Diagnostics walks the whole cause chain:
- If any link is an
Error, anInternalFailure, or one of a short list of JDK runtime exceptions that can only mean a coding mistake, the exception is an internal failure. An internal cause wins over an expected wrapper, soAstException("conversion failed", NullPointerException)stays a FWD defect. - Otherwise the innermost
Diagnosableor ANTLR link decides, because it is the most specific. - Anything matching nothing is an internal failure. Defaulting to internal keeps this honest: a new exception type has to be classified deliberately before it can become a diagnostic.
reportExpected() returns false as an instruction to the caller to keep treating the throwable as the internal failure it is.
reportInternalFailure() records one but does not handle it, the caller still propagates or aborts.
Migrated producers
Every migrated site keeps its existing output. Nothing that goes to the console or the cvt log today is changed, removed or duplicated; the manager only collects.
| Site | What now happens |
|---|---|
progress.g → reportError |
Reports a SYNTAX record with the exact token position. Warning during a class pre-scan, mirroring the 4GL's own tolerance of a referenced class that will not compile |
Environment.eprint/wprint |
PREPROCESSOR records with file, line and column. The -err/-warn writers are a documented option and still get written |
text.g, braces.g → reportError |
Now reported. ANTLR consumed these and they never incremented the error counter, so they previously reached no caller at all |
schema.g → reportError and outputWarning |
Same defect in the .df path, same fix. A malformed .df printed to stderr and was consumed |
AstGenerator |
The swallowed PreprocessorException, the E4GL catch, and the registry init failure |
ScanDriver |
Per-file catch splits expected from internal; sets the current unit; propagates the manager into workers. Resolves the standing TODO about overhauling error handling |
SymbolResolver |
The swallowed pre-scan failure reports a warning located at the class that failed, with the unit still the file being converted |
PatternEngine.handleRunThrowable |
Reports the legacy source problem as itself, or an INTERNAL record carrying the active rule report. failedProgramArtifacts and throwFailed still drive the run unchanged |
ImportWorker |
A SCHEMA record for an unreadable dump file. The ErrorManager call stays: there it is control flow, not the way the user is told |
| Four registry inits | catch (AstException) { // TODO: log this? } in AstGenerator, ScanDriver, PatternEngine, SchemaLoader now log and report fatal |
Command line
Two options, parsed in the shared TransformDriver.processCommandLine, so ConversionDriver and ProgressTransformDriver both have them.
| Option | Values | Default |
|---|---|---|
-diag:<level> |
none, fatal, error, warning, all | none |
-diagtype:<list> |
all, parse, or a comma separated list of record type names | all |
-diag: is a threshold: a level selects itself and everything more severe. It defaults to none, so an existing build, ant deploy and every other target, produces byte for byte the output it produced before this branch. One constant, TransformDriver.DEFAULT_DIAG_LEVEL, flips that once the output has been lived with.
-diagtype:parse expands to PREPROCESSOR + LEXER + SYNTAX, the three front end stages that turn 4GL text into an AST. COMPILE is deliberately outside parse: those records are also defects in the legacy source, but they are found while annotating and converting the tree, not while parsing it. Ask for parse,compile to get both.
Output is in this form, grouped by compilation unit and closed by a tally:
------------------------------------------------------------------------------
Diagnostics
------------------------------------------------------------------------------

./data/fwd.df
   ./data/fwd.df:37308:3: warning: ignoring unknown option FILE-MISC26 with value "" [schema]
   ./data/fwd.df:146688:2: error: expecting KW_PSC, found 'null' [schema]

4 fatal, 87 error, 1 warning (92 total, 2 shown)
The per level counts always describe the whole run, never the filtered subset, so narrowing the view cannot mislead you into thinking the other problems do not exist. N shown appears only when the filters actually hid something. info and hint are not accepted as thresholds: they are real Severity levels kept for the LSP mapping, but no producer emits them, so offering them would advertise options identical in effect to warning.
Testing
For testing, I used the same tests as in #3881 (34 tests)
| Options | Reported | Tally line, as printed |
|---|---|---|
-diag:all |
92 | 4 fatal, 87 error, 1 warning (92 total) |
-diagtype:schema -diag:all |
2 | 4 fatal, 87 error, 1 warning (92 total, 2 shown) |
-diagtype:parse -diag:all |
58 | 4 fatal, 87 error, 1 warning (92 total, 58 shown) |
-diagtype:syntax -diag:all |
58 | 4 fatal, 87 error, 1 warning (92 total, 58 shown) |
-diagtype:internal -diag:all |
4 | 4 fatal, 87 error, 1 warning (92 total, 4 shown) |
-diagtype:schema,internal -diag:all |
6 | 4 fatal, 87 error, 1 warning (92 total, 6 shown) |
-diagtype:compile -diag:all |
0 | Diagnostics: no diagnostics of type compile (92 other diagnostics reported). |
-diag:error |
91 | 4 fatal, 87 error, 1 warning (92 total, 91 shown) |
-diag:fatal |
4 | 4 fatal, 87 error, 1 warning (92 total, 4 shown) |
-diag:none |
0 | no section printed |
| no diagnostics option | 0 | no section printed |
The checks that matter:
- Type filter isolates.
-diagtype:schemareported exactly the 2schemarecords and dropped the other 90. - Union works.
-diagtype:schema,internalreported 6 = 2 + 4. - Threshold works.
-diag:errorreported 91, precisely one fewer than the baseline, and the run contains exactly one warning — which is the record that disappeared.-diag:fatalselected 4, and those are the same records-diagtype:internalselects, the two filters agreeing from opposite directions. - Both kinds of silence are unambiguous.
-diag:noneand a run with no option printed no section at all; a filter that matched nothing printed one line stating what it hid.
Option validation, through the real command line:
-diag:bogus         exit=249  Unknown diagnostic level 'bogus'  Expected one of: none|fatal|error|warning|all.
-diag:info          exit=249  Unknown diagnostic level 'info'  Expected one of: none|fatal|error|warning|all.
-diagtype:nonsense  exit=248  Unknown diagnostic type 'nonsense'  Expected a comma separated list of: all|parse|configuration|schema|preprocessor|lexer|syntax|symbol-resolution|compile|conversion|internal.
Every successful conversion exited 0.
Not covered yet
- Middle and back end. Only
f2was run, which is why-diagtype:compilematched nothing. - Error recovery. #3882's requirement that every error in a file be reported is not implemented; a file still stops at its first unrecoverable point. That needs ANTLR4, and it will probably be resolved in #3882 itself, not here.
- The origin positions of #3881. Locations are recorded as
UNMAPPEDuntil that lands.
Open question
- Would it make more sense to add the diag and diagtype values directly to
directory.xml? By default ant deploy doesn't display theDiagnosticssection at the end of the conversion output, but this could be achievable if we set the values directly from directory.xml.
#17 Updated by Paula Păstrăguș about 2 months ago
- File out.txt
 added
added
I attached the conversion output if java -DP2J_HOME=. -Xmx4g -cp "$CP" com.goldencode.p2j.convert.ConversionDriver -Sd2 -diagtype:all -diag:all f2 ./abl/err/ "*.p" is used, to see the full Diagnostics section.
#18 Updated by Greg Shah about 2 months ago
The diagtype compile probably should be called convert and it will be something we want to have be a composite like parse = preprocessor + lexer + syntax. I think we will need types for each phase of the conversion pipeline. I want to reserve compile for real javac failures and equivalent.
#19 Updated by Greg Shah about 2 months ago
Would it make more sense to add the diag and diagtype values directly to directory.xml? By default ant deploy doesn't display the Diagnostics section at the end of the conversion output, but this could be achievable if we set the values directly from directory.xml.
For normal conversion, we never need a directory.xml. I agree that for runtime conversion (e.g. dynamic queries), the directory.xml would be the place to customize it. For normal conversion runs, we should set a good default and then allow the value to be overridden in p2j.cfg.xml.
#20 Updated by Paula Păstrăguș about 2 months ago
Greg Shah wrote:
I think we will need types for each phase of the conversion pipeline.
------------------------------------------------------------------------------
Diagnostics
------------------------------------------------------------------------------

.
.
.

./abl/err/pp_fold_dbl.p
   ./abl/err/pp_fold_dbl.p:1:9: error: unexpected token: a [syntax] [phase=2]
   <unknown location>: fatal: Internal FWD failure while processing ./abl/err/pp_fold_dbl.p: com.goldencode.ast.AstException: Error processing ./abl/err/pp_fold_dbl.p [internal] [phase=2]

./abl/err/pp_fold_string.p
   ./abl/err/pp_fold_string.p:5:1: error: unexpected token: DISPALY [syntax] [phase=2]
   ./abl/err/pp_fold_string.p:5:9: error: unexpected token: "fold inside a string: misspelled below the folded literal" [syntax] [phase=2]
   <unknown location>: error: Error processing ./abl/err/pp_fold_string.p [conversion] [phase=2]

./abl/err/pp_fold_token.p
   ./abl/err/pp_fold_token.p:1:1: error: unexpected token: mes [syntax] [phase=2]
   <unknown location>: fatal: Internal FWD failure while processing ./abl/err/pp_fold_token.p: com.goldencode.ast.AstException: Error processing ./abl/err/pp_fold_token.p [internal] [phase=2]

./data/fwd.df
   ./data/fwd.df:37308:3: warning: ignoring unknown option FILE-MISC26 with value "" [schema] [phase=1]
   ./data/fwd.df:146688:2: error: expecting KW_PSC, found 'null' [schema] [phase=1]

<no artifact>
   <unknown location>: fatal: Internal FWD failure while running P2J Conversion Driver: java.lang.RuntimeException: Failed to execute rule-set  [internal] [phase=3]

phase=1: SchemaLoader
phase=2: Scanning Progress Source (preprocessor, lexer, parser, persist ASTs)
phase=3: Post-Parse Fixups

5 fatal, 87 error, 1 warning (93 total)
What do you think of this approach? The diagnostic record now uses a short field named phase instead of storing a full string. This field is resolved into a readable description via a PhaseCatalog interface. Doing it this way allows us to append a legend at the end of the diagnostics, making it easy to identify exactly which phase threw the errors.
#21 Updated by Paula Păstrăguș about 2 months ago
Furthermore, for every 4GL file, we should display an additional line that exposes the syntax error precisely as it appears in the cache file. This will typically look like this:
./abl/err/pp_fold_dbl.p
   ./abl/err/pp_fold_dbl.p:ORIG LINE:ORIG COLUMN: error: unexpected token: a [syntax] [phase=2]    ------> if the issue is within an include file, that should be displayed, instead of @./abl/err/pp_fold_dbl.p@
   ./abl/err/pp_fold_dbl.p.cache:1:9: error: unexpected token: a [syntax] [phase=2]    -----> 1 = CACHE LINE, 9 = CACHE COLUMN
#22 Updated by Greg Shah about 2 months ago
What do you think of this approach? The diagnostic record now uses a
shortfield namedphaseinstead of storing a full string. This field is resolved into a readable description via aPhaseCataloginterface. Doing it this way allows us to append a legend at the end of the diagnostics, making it easy to identify exactly which phase threw the errors.
I think there is some merit in the idea. But, if we summarize at that level:
- We may lose imporant information. For example, the phase 2 is far too broad. We would want to know if an issue is in the preprocessor or the lexer or the parser.
- Some tooling in FWD may not fall into this model. The model works for
ConversionDriverbut we will need diagnostics for other processes too.
#23 Updated by Greg Shah about 2 months ago
Paula Păstrăguș wrote:
Furthermore, for every 4GL file, we should display an additional line that exposes the syntax error precisely as it appears in the cache file. This will typically look like this:
[...]
I'm not sure what this means. Where does that text come from? It doesn't seem to be the 4GL line of code itself (which would be very useful).
#24 Updated by Paula Păstrăguș about 2 months ago
Greg Shah wrote:
Paula Păstrăguș wrote:
Furthermore, for every 4GL file, we should display an additional line that exposes the syntax error precisely as it appears in the cache file. This will typically look like this:
[...]
I'm not sure what this means. Where does that text come from? It doesn't seem to be the 4GL line of code itself (which would be very useful).
I manually drafted the output in the pre block to ensure we are aligned. My main point is that when the diagnostics report a parse error, it would be highly beneficial to display the error's exact location in the cache file (cache line and column) right alongside the original location in the .p or .w file.
#25 Updated by Greg Shah about 2 months ago
Yes, we must capture BOTH the original location and the cache file location. The #3881 task was never meant to remove the cache file location, it was meant to add the original location data.
#26 Updated by Paula Păstrăguș about 2 months ago
Here are some details about the current diagnostics implementation.
The initial implementation was developed based on the ConversionDriver.. and the needs of the conversion flow, so some of the fields in DiagnosticsRecord are specific to that context. For example, phase represents the job phase that was running when the diagnostic was reported.
One point from the discussion is that DiagnosticsRecord should be generic enough to be reused for both compile-time/convert diagnostics and runtime diagnostics. A runtime diagnostic, for example, does not necessarily have a phase, so phase should not be part of the generic/common diagnostic information.
The common record should therefore focus on information that can be meaningful for any diagnostic, such as the sequence/order, severity, diagnostic type, code, message, source location, and optionally the affected unit, reporting thread, or originating exception (maybe also a timestamp).
If there are any other fields that would be useful for diagnostics, please let me know so I can take them into account in the design.
#27 Updated by Paula Păstrăguș about 1 month ago
11424b rev 16720 contains the following:
- Generalized the diagnostics beyond the conversion: removed the phase, which not every diagnostic has;
- Reduced DiagnosticType to eight general kinds, with SYNTAX renamed PARSER and COMPILE dropped;
- Added the record's timestamp and the cache file its position was observed in;
- Made Diagnostics the single static entry point for reporting;
- Defaulted the -diag:/-diagtype: options from p2j.cfg.xml.
#28 Updated by Paula Păstrăguș about 1 month ago
Greg, this task is also meant to collect the errors at runtime for dynamic queries as diagnostics?
#29 Updated by Paula Păstrăguș about 1 month ago
- File proc_not_found.png added
While testing this branch, I found an interesting test case that is currently failing in FWD. It looks like a procedure isn't resolving correctly, which throws the error shown below. Could you let me know if this is a known issue/regression? If not, I'll go ahead and open a separate ticket for it.
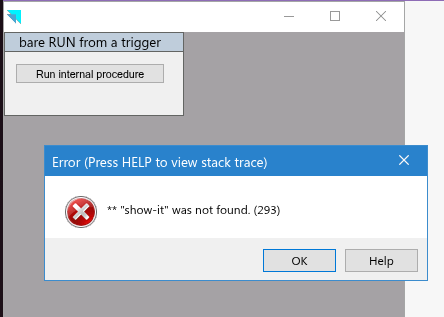
#30 Updated by Paula Păstrăguș about 1 month ago
Here's the testcase:
DEFINE BUTTON b-go LABEL "Run internal procedure" SIZE 30 BY 1.

DEFINE FRAME f-main
   b-go AT ROW 1.5 COLUMN 3
   WITH SIDE-LABELS THREE-D AT COLUMN 1 ROW 1 SIZE 36 BY 4
        TITLE "bare RUN from a trigger".

PROCEDURE show-it:
   DEFINE INPUT PARAMETER p-from AS CHARACTER NO-UNDO.

   MESSAGE "show-it was reached from" p-from VIEW-AS ALERT-BOX INFORMATION.
END PROCEDURE.

ON CHOOSE OF b-go
DO:
   RUN show-it ("a trigger").   // ------> show-it is not resolved here!
END.

ENABLE ALL WITH FRAME f-main.

WAIT-FOR CLOSE OF THIS-PROCEDURE.
#31 Updated by Paula Păstrăguș about 1 month ago
Actually, it was a project misconfiguration regarding the name_map.xml file, I've fixed that and the testcase from above it's working just fine.
#32 Updated by Paula Păstrăguș about 1 month ago
- Status changed from New to WIP
Rev 16721 contains the following:
- Collected the diagnostics of dynamic conversion at run time (per client): dynamic query predicates and validation expressions, gated by the
persistence/dynamic-conversion-diagnosticsdirectory node which is disabled by default. - Added the record's source text, since a dynamic predicate or expression is in no persistent file.
#33 Updated by Paula Păstrăguș about 1 month ago
- Status changed from WIP to Review
- % Done changed from 0 to 100
#34 Updated by Greg Shah about 1 month ago
There is no branch ~/secure/code/p2j_repo/p2j/active/11424b/.
#35 Updated by Paula Păstrăguș about 1 month ago
11423b, not 11424b
#36 Updated by Greg Shah about 1 month ago
Sorry, I just cut and pasted from #11423-27 and didn't notice the typo.
#37 Updated by Paula Păstrăguș about 1 month ago
No problem, I mistyped:)