Debugging Techniques
- Debugging Techniques
This chapter discusses some advanced (and perhaps not-so-advanced, but nevertheless useful) techniques for tracking down problems in converted (and hand-written) business logic code, as well as in the FWD runtime environment itself. We will not be starting from scratch; the Debugging Converted Code chapter of the FWD Conversion Handbook is prerequisite reading. While that chapter discusses an approach to confirming deviations from the original application, and a survey of the tools available to help isolate problems, here we will dig a bit deeper into the specifics of the FWD runtime infrastructure and how these affect debugging. We will cover the FWD logging facility from the point of view of a developer, and we will review how the structure of converted code affects interactive debugging.
Block Processing
One of the most striking mismatches between Progress 4GL code and Java code is that 4GL code is block-structured, while Java is not. That is, certain sets of 4GL statements, from an external procedure down to a simple FOR EACH loop, define constructs known as blocks. While certain groups of Java statements are said to form a block as well, Java is not considered a block-structured language. Understanding this mismatch, and how FWD compensates for it, is important when reading and debugging converted application code.
A block in the 4GL sense is much more than the code it contains. The block construct defines a great deal of implicit behavior, which is not necessarily obvious to a developer. This includes defining, expanding, or otherwise modifying the scope of variables, data record buffers, transactions, and user interface frames. A block can be assigned properties (some are assigned implicitly) which define responses to user events, errors, or other conditions. These can impact the values of variables or database table fields, which may have changes made to them within the scope of the block undone, under certain circumstances. The way a block exits is dependent upon such properties.
This implicit block behavior is preserved in a converted application, but the requirement to do so has implications on the structure of the Java business logic generated by the conversion process. In an earlier version of the conversion technology, the control flow logic to mimic this behavior explicitly was emitted as Java code into the business logic. This “scaffold code” required an ugly combination of loops and nested try-catch blocks for every converted Progress block. In many cases the scaffold code was several times larger than the business logic statements themselves! This extremely verbose representation was duplicative and difficult to read and maintain.
The current version of the conversion technology emits a much more compact representation of Java business logic code. It achieves the same behavioral result, but with much less emitted application code. The control flow governing implicit block behavior is now encapsulated, to the degree possible, in FWD runtime code. To do this, a callback mechanism is employed. Converted code for each Progress block is emitted within methods of an anonymous, inner class. This class is a subclass of the abstract com.goldencode.p2j.util.Block class. The class com.goldencode.p2j.util.BlockManager drives the appropriate control flow for the type of block which was converted, invoking the appropriate, call-back methods implemented in the anonymous inner class in the business logic.
Consider the following FOR EACH loop from the sample test case primes.p. This code defines a temp-table named list. At some point, we assume the temp-table has been populated, and then the loop below displays the value of the num field of each record in list:
def temp-table list field num as int.
...

for each list where list.num >= 0:
   display list.num label "Prime Number" with 10 down.
end.
This is converted to the following Java application code:
import static com.goldencode.p2j.util.BlockManager.*;
...

TempRecord1 list = TemporaryBuffer.define(TempRecord1.class, "list", false);

PrimesFrame0 frame0 = GenericFrame.createFrame(PrimesFrame0.class, "");

...

   forEach("loopLabel2", new Block()
   {
      AdaptiveQuery query0 = null;

      public void init()
      {
         frame0.openScope();
         query0 = new AdaptiveQuery(list, "list.num >= 0", null, "list.id asc");
      }

      public void body()
      {
         query0.next();

         FrameElement[] elementList1 = new FrameElement[]
         {
            new Element(new FieldReference(list, "num"), frame0.widgetNum())
         };

         frame0.display(elementList1);
      }
   });
The block defined by the FOR EACH loop in the Progress code is implemented here as a subclass of the abstract class com.goldencode.p2j.util.Block, with the default init method overridden and the abstract body method implemented. This anonymous inner class is instantiated and passed as the second argument to the static forEach method of com.goldencode.p2j.util.BlockManager.
The init method explicitly defines a scope for frame0, which corresponds with the default frame created in the Progress runtime. It also constructs an object to perform the database query, in this case an instance of com.goldencode.p2j.persist.AdaptiveQuery, which commonly is used to perform the data access work of a converted FOR EACH statement. This method will be invoked once by BlockManager.forEach, to initialize the block.
After the block is initialized, the body method is invoked by BlockManager.forEach. The call to query0.next() attempts to load into a record buffer named list the next available record from the backing temporary table. If a record exists, it is loaded into the list buffer, which represents a Data Model Object (DMO) of type TempRecord1. Next, an array of FrameElement objects is defined, within which the DMO property list.num is associated with a user interface widget in frame frame0. Finally, frame0 is asked to display this list of FrameElement objects.
Control then drops back into the BlockManager.forEach method, which performs some internal processing for the block, and eventually calls the body method again. It will do this repeatedly, until the invocation of query0.next() throws an exception to indicate there are no more records to be retrieved. Alternatively, something else in the body method could cause an error or otherwise create a condition which triggers an exception. In any event, BlockManager.forEach will catch the exception and handle it accordingly, performing the block behavior which is appropriate to the original application.
This inversion of control model, in which application logic is implemented in callback methods invoked by the runtime environment, has important implications for debugging converted code. It is important to remember that this model is pervasive in converted business logic, since the use of blocks is such an integral aspect of writing Progress 4GL programs. It is not uncommon to see deeply nested examples of this structure in converted code, where the body method of one Block implementation contains many other Block instances. This is simply because blocks are naturally and commonly nested in Progress code.
An understanding of this model, its reason for being, and the mechanics of the runtime code which supports it, is crucial when reading converted code. This must be kept in mind when deciding where to insert logging statements, where to place breakpoints and how best to step through code for interactive, source-level debugging, and when interpreting profiling results. We will discuss this model as it relates to these issues in greater detail in the sections below.
Logging
Impact of inversion of control in block code
Source Level Debugging
WARNING: In some cases, especially for the FWD client, FWD detects that debug mode is active and automatically overrides entries from directory.xml. This can be very confusing for developers because directory.xml changes seem like they are not being picked up. Please check the following code when debugging and make sure the parameters are set to your liking (WebClientBuilderParameters.DEBUG_PROFILE):
   /** Unmodifiable map of client config : default value pairs for the debug profile. */
   private static final Map<ConfigItem, String> DEBUG_PROFILE =
      Collections.unmodifiableMap(new HashMap<ConfigItem, String>() {
         {
            put(ConfigItem.WEB_SOCKET_TIMEOUT, String.valueOf(20 * 60 * 1000));
            put(ConfigItem.WATCHDOG_TIMEOUT, String.valueOf(40 * 60 * 1000));
            put(ConfigItem.MAX_IDLE_TIME, String.valueOf(20 * 60 * 1000));
            put(ConfigItem.MAX_HTTP_IDLE_TIME, String.valueOf(WebConfigurationConstants.INFINITE_TIMEOUT));
            put(ConfigItem.CONNECT_RETRY_DELAY,
                String.valueOf(WebConfigurationConstants.DELAY_BETWEEN_CONNECT_TRIES));
            put(ConfigItem.PING_PONG_INTERVAL, String.valueOf(20 * 60 * 1000));
            put(ConfigItem.JS_DEBUG_LOGGING, String.valueOf(true));
         }});
On the contrary, if there are directory.xml changes needed only for debugging, modifying this constant is a smart way to inject debug only parameters.
Eclipse project setup
Let's take a look how we can create a Java project into Eclipse in order to be able to debug converted sources of your project and FWD framework.
- Initiate creation of a Java project from the Eclipse menu.

- Specify the project name and select a proper JRE (which has p2jspi.jar installed as an extension).

- Attach FWD sources which reside into p2j/src. Depending on your needs, you can import them (files will be copied to the source folder of the project) or link them (files will be edited in their original locations). In our example we will link them.


- Attach all third-party libraries (jars) used by FWD which reside into p2j/lib directory.


- Attach the sources of your converted project (usually reside in the <project_home>/src directory).

- Your project source tree will look something like this:

- In order to simplify debugging, you can run FWD server right from the Eclipse. You should create debug a configuration where you should specify:
- main class: com.goldencode.p2j.main.ServerDriver
- optionally, into program arguments: the server bootstrap configuration file name, usually server.xml
- VM parameters: the parameters that will allow the server to have enough resources, e.g. -Xmx1024m -server
- working directory: the FWD server home directory (where the server start up script resides).


- Now you can run the newly created debug configuration and watch the server staring:

Remote Debugging of FWD Server and Client Using Eclipse
In order to perform remote debugging you should create an Eclipse project containing sources of FWD framework and/or sources of your converted project. See previous section on how to do it.
Follow these steps to perform debugging of a FWD server:
- Create a configuration for remote debugging. Specify a target host on which the target server will run and debug port number (usually 2080 + <server instance number>)

- Run FWD server with enabled debug mode: ./server.sh -d
- Attach to the FWD server from the Eclipse using the created debug configuration.
Follow these steps to perform debugging of a FWD client:
- Create a configuration for remote debugging. Specify a target host on which the target client will run and custom debug port number.

- Run FWD client with enabled debug mode: ./client.sh -d<custom port number> E.g.: ./client.sh -d5000
- Attach to the FWD client from the Eclipse using the created debug configuration.
Manually Starting FWD Client or Server with Debugging Enabled
Any java process can be have debugging enabled by adding the following to the java command line:
-Xdebug -Xnoagent -Djava.compiler=NONE -Xrunjdwp:transport=dt_socket,address=<port_num>,server=y,suspend=<y_or_n>
The <port_num> would be whatever you want to use for TCP/IP connection from the debugger. For suspend, use y to make the process block immediately and n to let the process run normally. Suspending is useful for cases where you want to debug the startup of the client or server, but under normal conditions you don't need to suspend.
Once specified, you would start the debugger and connect to the defined port.
The client.sh and server.sh scripts implement this debugging enablement when the -d is used. If you are using those scripts there is no need to manually add these overrides.
Debugging the Web Client
The web client is started "indirectly" by the FWD server in response to a web-based login request from a user. This means that:
- You cannot configure an Eclipse launcher to start a web client.
- The FWD server must be configured to know how to launch the web client.
To enable debugging of a web client, the directory must be updated before starting the FWD server. In directory.xml, find the clientConfig node and add or edit the jvmArgs child node:
          <node class="string" name="jvmArgs">
            <node-attribute name="value" value="-Xmx512m -Djava.awt.headless=true -Xdebug -Xnoagent -Djava.compiler=NONE -Xrunjdwp:transport=dt_socket,address=2080,server=y,suspend=n"/>
          </node>
The key part that needs to be added to this entry is the -Xdebug -Xnoagent -Djava.compiler=NONE -Xrunjdwp:transport=dt_socket,address=2080,server=y,suspend=n. As noted above, you should change the address to be the port number you want to use for the debugging connection and the suspend should be set to y or n as needed.
After this change is made, start the FWD server and then connect via a web browser just as a normal user would. After the web client starts, you can attach to the process from the Eclipse debugger and debug from there as you normally would.
When you are done debugging, if you don't terminate the client from the web browser, or from the attached debugger, then you must manually kill the ClientDriver java process before you will be able to connect again.
If it is required to debug two or more web clients or to start JMX clients, then the FWD server should be provided with agent port range. The agent port range is given by using these directory nodes clientConfig/minAgentPort and clientConfig/maxAgentPort. This is an example of the fragment of the directory.xml related to this java debugger and JMX agents setup
<node class="container" name="clientConfig">
          .............................................
          <node class="integer" name="minAgentPort">
            <node-attribute name="value" value="9020"/>
          </node>
          <node class="integer" name="maxAgentPort">
            <node-attribute name="value" value="9120"/>
          </node>
          <node class="string" name="spawner">
            <node-attribute name="value" value="[PATH to spawn executable]"/>
          </node>
          <node class="string" name="jvmArgs">
            <node-attribute name="value" value="-Xmx1024m -Djava.awt.headless=true -Xdebug -Djava.compiler=NONE -Xrunjdwp:transport=dt_socket,server=y,suspend=n,address=9020 -Dcom.sun.management.jmxremote=true -Dcom.sun.management.jmxremote.port=9021 -Dcom.sun.management.jmxremote.authenticate=false -Dcom.sun.management.jmxremote.ssl=false"/>
          </node>
          ..............................................
        </node>
In this configuration
minAgentPort to maxAgentPort are distributed between agents by the following rule. The first port is assigned for the java debugger and the next one is assigned to JMX agent, the next ports are distributed accordingly, the first one is for the debugger and the next one is for jmx agent. Thus the first started web client utilizes 9020 and 9021 ports for its java debugger and its JMX agent respectively, and the next web client utilizes 9022 and 9023 ports for its debugger and JMX agents respectively and so forth.
To be able to use breakpoints when debugging web client it needs to increase watchdog and idle timeouts under webClient directory node
          <node class="integer" name="maxIdleTime">
            <node-attribute name="value" value="90000"/>
          </node>
          <node class="integer" name="maxHttpIdleTimeout">
            <node-attribute name="value" value="90000"/>
          </node>
          <node class="integer" name="watchdogTimeout">
            <node-attribute name="value" value="120000"/>
          </node>
          <node class="integer" name="pingPongInterval">
            <node-attribute name="value" value="30000"/>
          </node>
          <node class="integer" name="maxLostPings">
            <node-attribute name="value" value="6"/>
          </node>
          <node class="integer" name="delayBetweenPingTries">
            <node-attribute name="value" value="5000"/>
          </node>
          <node class="integer" name="delayBetweenTriesToConnect">
            <node-attribute name="value" value="1000"/>
          </node>
where timeout parameters are given in milliseconds.
These values should be coherent with each others so the java web client side can be still alive within watchdogTimeout time after the java client has detected the web socket connection is failed. These conditions should be hold maxIdleTime = maxHttpIdleTimeout, maxIdleTime + pingPongInterval <= watchdogTimeout, and delayBetweenPingTries * maxLostPings <= pingPongInterval
The js client starts trying to restore its web socket connection after it detects maxLostPings PING messages are already lost. The Jetty web socket servlet and web server are configured so that they can hold idle connections up to maxHttpIdleTimeout. These two different parameters maxIdleTime = maxHttpIdleTimeout should be merged.
For debugging these parameters can be set: maxIdleTime = maxHttpIdleTimeout, maxIdleTime = 2*pingPongInterval and watchdogTimeout=3*pingPongInterval anddelayBetweenPingTries * maxLostPings = pingPongInterval. So to be able debugging at breakpoints pingPongInterval=300000 (5 minutes,..) should be increased.
Using the Debugger to Find the Current Point of Execution for a Blocked/Paused Application
There are times when the application is running but it is paused at a prompt (e.g. MESSAGE ... VIEW-AS ALERT-BOX or PAUSE) or is processing some long running process (maybe even an infinite loop). In the Ecipse Debug Perspective, the left side column, Debug tab shows the list of threads in the connected JVM.
When the debugger has not yet suspended the execution of the JVM, you cannot see any stack trace in that thread list. But when execution is suspended (e.g. a breakpoint was hit), then for the current thread it shows the exact stack trace of the current point of execution. For example:
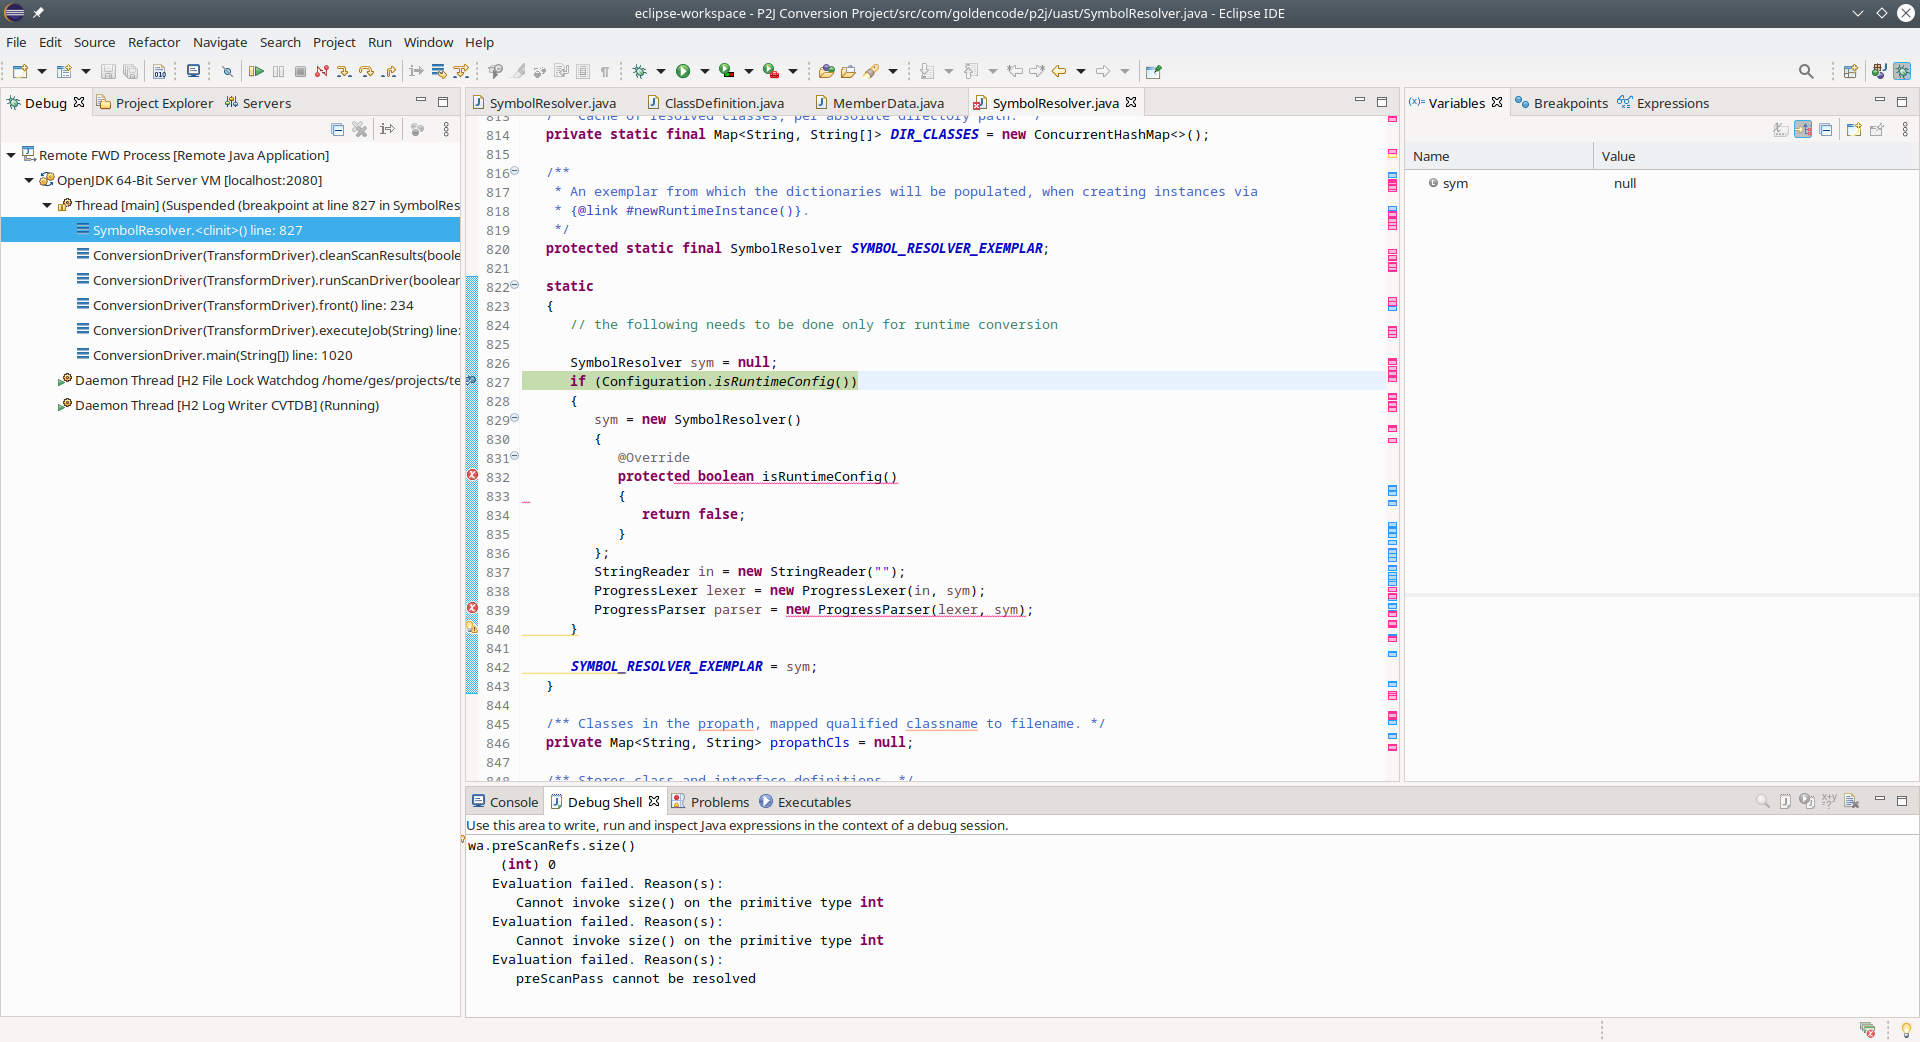
The trick here is that execution must be suspended for this to appear. If the application is paused at a message box but the debugger has not suspended the application's execution, you can manually suspend the execution.
After you attach the Eclipse debugger to the FWD server, look for a Conversation thread, select it and press the "Suspend" button (it looks like this  ) - this will suspend the entire JVM process' execution, expand that thread and allow you to see the stacktrace.
At that point you can inspect the stack and even click on any of the stack trace elements to switch to that location in the source code. All normal debugging facilities will be available, for example the variables on the stack will be available to view/manipulate on the right side in the Variables panel.
If you want to continue debugging starting at that spot, press Step Over (F6) somewhere down the stacktrace, go back to the Web Client (in the browser), dismiss the alert/dialog-box and you can then continue execution via the debug buttons.
Useful Locations for Breakpoints
On the FWD server:
| Purpose | Method |
|---|---|
| Buffer Initialization | RecordBuffer.initialize() |
| CompoundQuery processing | CompoundQuery.retrieve() |
| Control Flow | com.goldencode.p2j.util.Block.Block() |
| Database Initialization | DatabaseManager.registerDatabase() |
| Database Field Assignment | RecordBuffer.Handler.invoke() or RecordBuffer.endBatch() for batch assignment |
| Database Field Validation | |
| Table/Record Validation | |
| Incorrect Browse Rows | |
| Record Locking | |
| Table/Record Commit/Rollback | |
| Table/Record Creation | |
| Server Startup | StandardServer.bootstrap() |
| Session Startup | SecurityManager.addSession() (on the server) |
On FWD client:
| Purpose | Method |
|---|---|
| Editor | Editor.parseContent() |
| FillIn Key Processing | FillIn.processKeyEvent() |
| Frame Hiding | Frame.setVisible() |
| Frame Placement | Screen.placeFrame() |
| Focus | ThinClient.waitForWorker(), ThinClient.setFocusOn(), ThinClient.adjustFocus(), ThinClient.tryFocusChange(), ThinClient.focusChange(), ThinClient.setFocusSilent(), ThinClient.apply() |
| Layout | ZeroColumnLayout.calcLayout() |
| Low-Level UI Events | ThinClient.processEvents() |
| Progress 4GL Events | ThinClient.processProgressEvent() |
Interacting with a Live Database
Interacting (execute queries, and other valid SQL statement) with a standalone database server (e.g. PostgreSQL) is relatively simple: just open a new connection with a database client (psql command line for PostgreSQL, for example) and execute your statements. However, this has several disadvantages:
- It cannot be done with in-memory (temp-tables, _meta tables) database;
- You only see the finished transactions (well, this might be the intent in some cases);
- The database might change because of the application server interactions.
There are other solutions here.
Step 1. Preparation.
The FWD server must be run with a debugger (IDE) attached (it does not matter whether the process was started from the IDE or the IDE attached to an already running process). You must prepare for the debugging session by finding some basic information about the database:
The buffers. For example ttTrouble buffer is defined as:
TtTrouble_3_1.Buf ttTrouble = TemporaryBuffer.define(TtTrouble_3_1.Buf.class, "ttTrouble", "ttTrouble", false, false);
Navigating back to its DMO interface:
public interface TtTrouble_3
notice the annotation which will get you the name of the table in SQL:
@Table(name = "tt3810", legacy = "ttTrouble")
Then, for each legacy field, you can find a getter annotated with @Property like:
   @Property(id = 2, name = "defaultFont", column = "default_font", legacy = "default-font", format = "yes/no", initial = "false", order = 10)
   public logical isDefaultFont();
The SQL name of the field is given by name option.
In a similar fashion information on the @Indices may be reached. The sequences can be found in a special class _Sequences for each schema.
Step 2. Patch Session to make the server console an interactive SQL client.
Use the following patch:
You can have only one client logged in for this to work. You write the SQLs at the prompt where the server.sh was started (FWD Server's STDIN) and see the output in the server.log.
Step 3. View the content of a table.
A. If a RecordBuffer instance is available.
This technique works best if there are limited number of records in a table and you are interested in seeing them all or checking whether there are any records in the table.
If a RecordBuffer instance is available (and initialized) you can see the content of its table in a familiar SQL fashion. The Init block of a query is optimal place for placing a breakpoint but this can be done at any given location, like before executing a FIND statement. When the execution stops at designed place, use your IDE's Evaluate feature to execute the sqlTableContent(n) on the desired buffer to get the content of its table. The argument acts as limit option of the SQL SELECT statement. The value 0 will cause all records to be returned. If there are a lot of records the procedure may take a long time so an acceptable fixed value should be used instead. Note that the order of the records cannot be specified and is given by its table primary index.
Example:
For the following buffer:
TmpTable_1.Buf tmpTable = (TmpTable_1.Buf) TemporaryBuffer.useShared("tmpTable", TmpTable_1.Buf.class);
put a breakpint on a line like:
new FindQuery(tmpTable, (String) null, null, "tmpTable.f2 asc", LockType.NONE).findFirst()
and evaluate in the IDE
((BufferImpl) tmpTable).buffer().sqlTableContent(0).
to obtain a result like:
ABL: tmp-table / SQL:tt232
RECID    | _MULTIPLEX | _ERRORFLAG | _ORIGINROWID | _ERRORSTRING | _PEERROWID | _ROWSTATE |   F1 |   F2   |  __SF2  | F3
---------+------------+------------+--------------+--------------+------------+-----------+------+--------+---------+-----
 2304045 |       2231 |       null |         null | null         |       null |      null |    1 | abc    | abc     | 10
[...]
If you are working with DATASETs, there is a getSqlData() in the com.goldencode.p2j.persist.DataSet, too. It will list the full content of the dataset. There is no way to specify a limit for the number of rows returned, this method is similar to result of the concatenation of all tables (and their before-images) from the dataset.
B. If a handle to a DMO Proxy is available.
If you have a handle h and h.unwrapBuffer() returns a DMO proxy instance, you can turn that into a RecordBuffer instance. Once you have the DMO proxy from the handle, you can cast it to a BufferImpl and invoke the buffer() method on it to retrieve the RecordBuffer instance. From there the details in section A above can be followed.
Step 4. Reverse engineering the definition of a table.
If you need to see the structure a table (how the table was define in original 4GL code) use com.goldencode.p2j.persist.orm.DmoMeta.getTableDefinition() method at any given moment when a DmoMeta is available. The result of this method is also available using RecordBuffer and BufferImpl, via tableDefinition() method. The declaration is not a 100% representation of the original but you get the most information on table attributes, fields and indices.
This API is for internal use/debugging and never exposed to converted code. It will be updated periodically based on FWD internal needs.
Note that this works for static and dynamic temp-tables and permanent tables although the format returned uses the DEFINE TEMP-TABLE syntax rather than .df file format.
Step 5. (Advanced) Execute ANY SQL statement on a specific database if a RecordBuffer instance is available.
Again, if a RecordBuffer instance is available, you can issue any SQL statement over its database. This is not limited to SQL SELECT statements so this is a very powerful tool for both visualizing the current state of the database and even altering it, using INSERT, UPDATE and DELETE statements, and other. For this reason, use these statements carefully since you can break the database to a state that a reimport or a full restore is necessary.
As in previous technique, suspend the FWD server at a breakpoint on a line of your choice. For example, to obtain the number of the records in the table, execute in the Evaluate box of your IDE:
((BufferImpl) tmpTable).buffer().getPersistence().getSession().getConnection().prepareStatement("select count(*) from tt232").executeQuery()
This time the result will not be as readable because the result is not a plain String but a ResultSet instead. Depending on the dialect and the loaded driver, the rows returned may be in various formats. You need to adapt to exact situation and use the IDE's features to extract the information you need.
Notes:
- use the first technique above to known the table and field SQL names in advance;
- this can be used for working with tables, sequences, invoke FWD UDFs or any combinations of these;
- any number of tables can be used in a JOIN as long as they belong to same database. Inter-database operations are NOT possible. The buffer may not appear at all in the statement, it will only provide the connection to respective database;
- the result of the statement will reflect or be reflected by the state of the database in the current context. If no
commitwas executed, it is possible that from other connections to same database (like usingpsqlutility) the results to be different; - before evaluating the expression, take the time and double check the syntax of the statement. If there is a syntax error, depending on the SQL driver used, not only an
SqlExceptionwill be thrown, but the connection to database can be broken which could male the FWD server unable to continue its normal execution after the debugging session ends.
© 2004-2021 Golden Code Development Corporation. ALL RIGHTS RESERVED.