Standard Code and Schema Reports
Introduction
A big part of running the Report Generation step is to calculate the results for a list of several hundred predefined reports. These reports cover both 4GL source code (Code Reports) and the schemata (Schema Reports).
The predefined reports provide an extensive set of views into the application. This facility provides the capability to explore the application and answer many questions without having to write special search expressions. For example, it is easily possible to find all locations in the application that reference a specific database field or to see the list of all the locations that define a new shared variable of a given name. These are things that can be very tricky to find using traditional "grep" or text file searching. The FWD Code Analytics provides a uniquely powerful set of tools to do all of this and much more.
It is also possible to create Custom Reports that are unique to a given application. Any custom reports that have been created are also run at the same time as the predefined reports.
Everything described in this chapter will use examples for the Code Reports, but the usage of the Schema Reports is exactly the same. The difference is that the Schema Reports are based on processing the ASTs from .df files and TEMP-TABLE/WORK-TABLE definitions instead of ASTs from 4GL source code.
Available Reports List
This is an example of the Code Reports screen when first accessed:
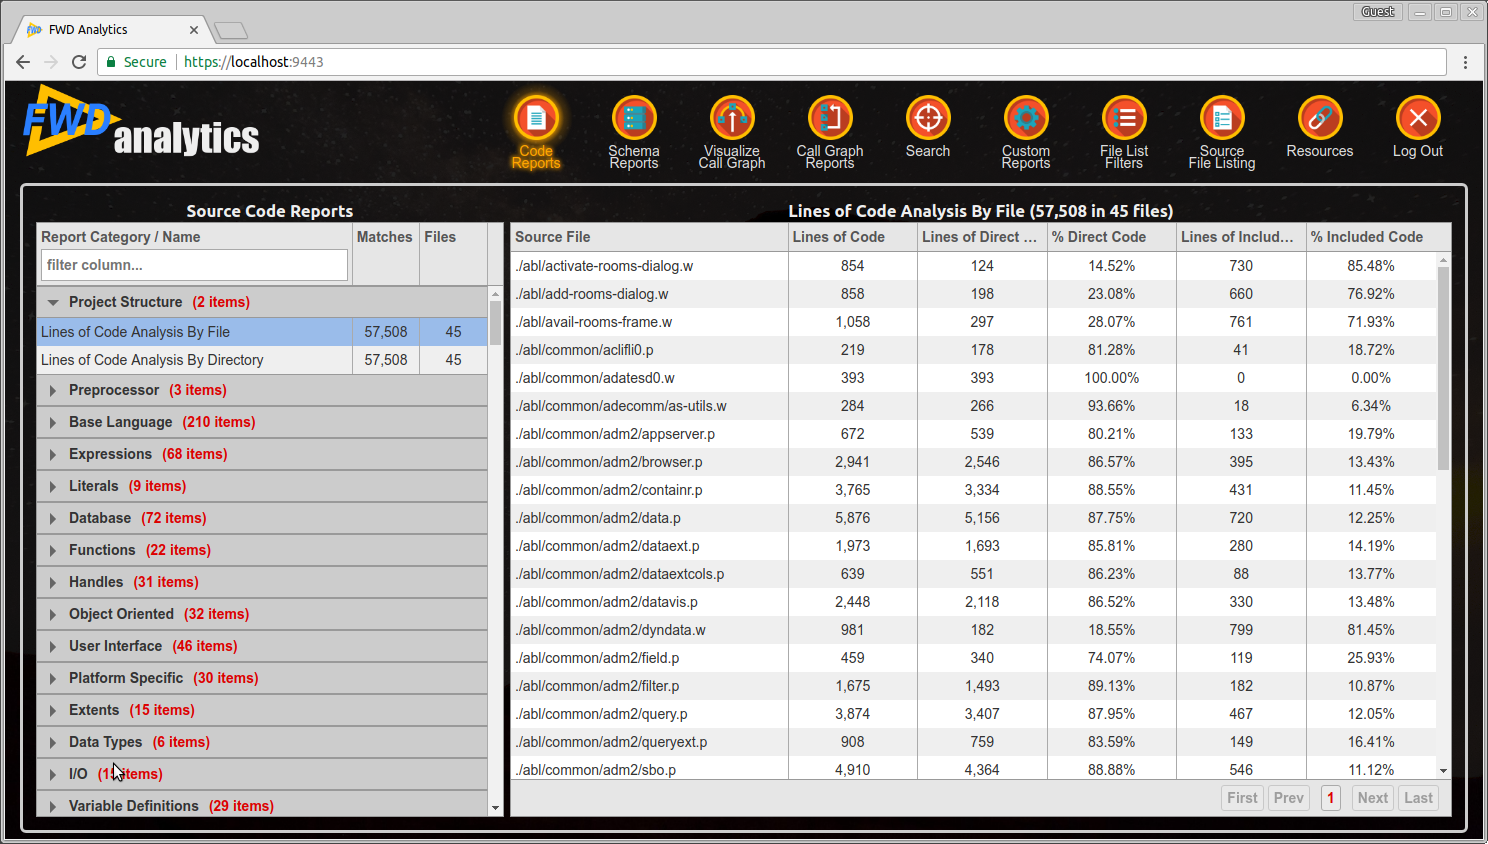
The list of available reports can be seen in the column on the left side:
The first time reports are generated, the available reports will only include the standard/predefined reports that are part of the Code Analytics tools. Any usage of the Custom Reports feature to create new reports will cause those reports to also be available in this location. Those reports are automatically exported when the report server exits, and future report generation runs will include those additional custom reports. This means that once a custom report has been added, it will always be listed in the available reports list.
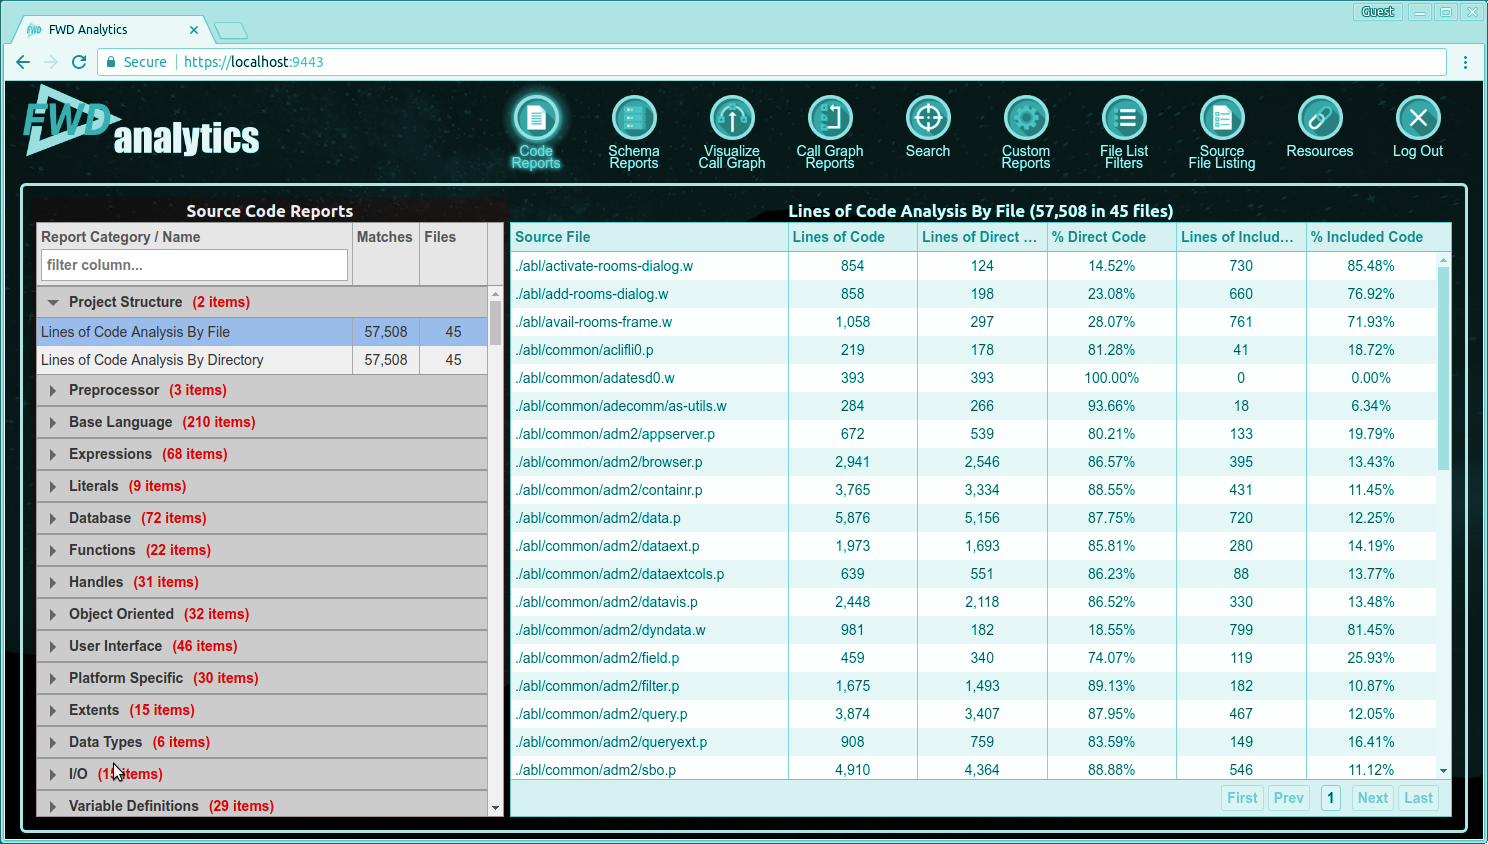
There are hundreds of predefined reports. To make it easier to navigate, the reports have been organized into categories. Each category can be expanded or collapsed to show/hide the contained reports. Use the vertical scrollbar to see the entire list of categories. Click on the small right pointing arrow to expand a category:

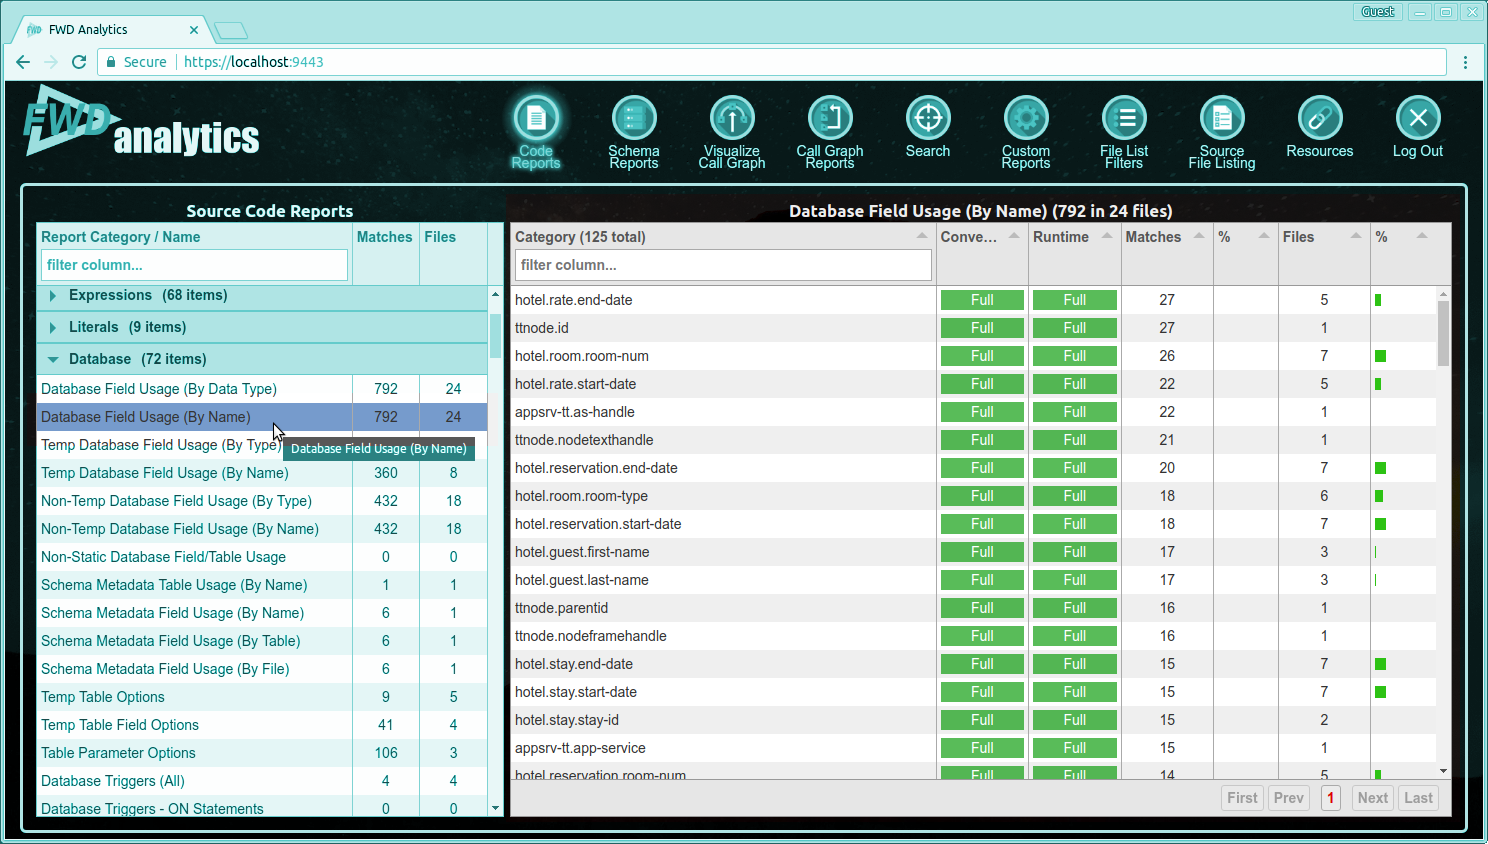
Some categories contain a large number of reports. Use the vertical scrollbar to see all of them. When you click on a specific report name, that report will be loaded as the currently displayed report on the right side:
At the top of the available reports list, there is an entry field for filtering the reports based on a specific report name:

Type text into the field and the system will show the case-insensitive matches on report names that contain that text. For example, type "field usage" and the available report list will only display those categories which contain report names that include the text "field usage". Expanding a category will only show those reports with names that match:
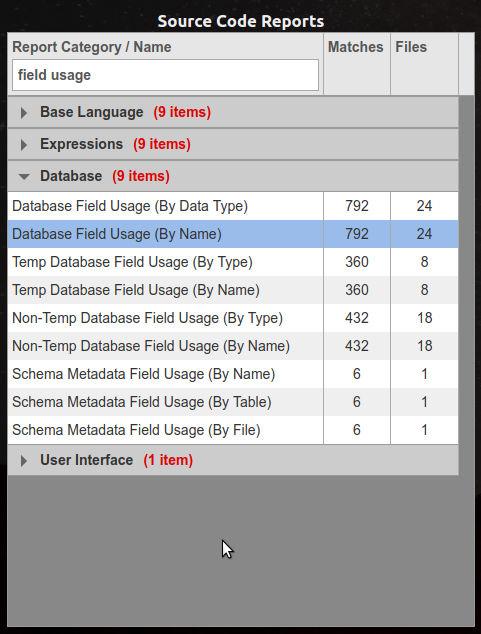
Delete the text from the entry field to clear the filter.
Currently Displayed Report
The right side of the Code Reports or Schema Reports screen is dedicated to the currently displayed report.
There are two things that can be displayed in that space:
- Summary Report
- Details Report
Summary Report
When a report is selected from the available reports list, the selected Summary Report is loaded into the right side of the screen:
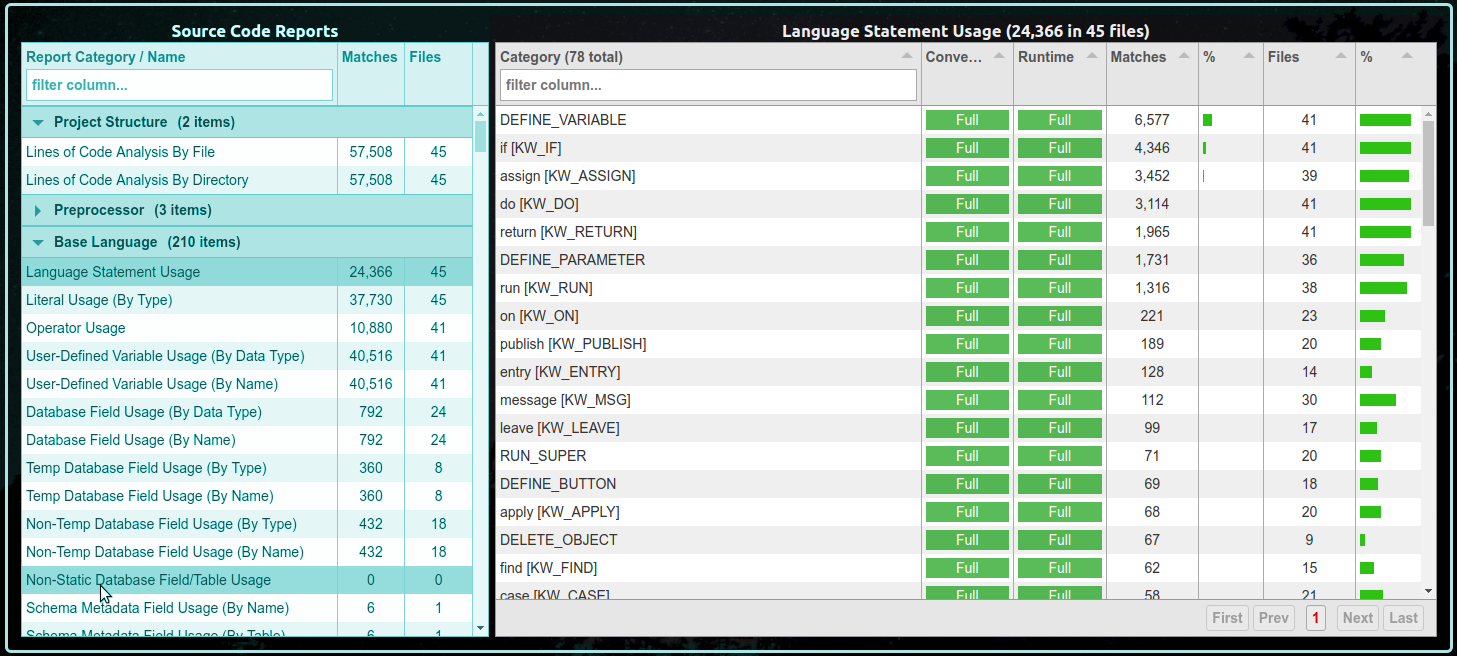
The title is the report name (e.g. "Language Statement Usage") followed by the total number of matches (e.g. there are 24,366 matches to a Language Statement) and the number of files that contained matches (e.g. 45).
Each report has a match condition that is being used to determine whether an AST node (from the code or a schema) should be included in the report. This match condition is a single boolean expression, which can be of arbitrary complexity.
There are either 5 or 7 columns in a standard Summary Report:
| Column Name | Required | Meaning |
|---|---|---|
| Category | Yes | Each match in a report will be categorized into a single named "bucket" called a Category. The categories are mutually exclusive. The matches in one category can never appear in another category for the same report. The total number of categories is in parenthesis in the header of the column (e.g. 78 in this example). If you want to quickly jump to a specific category name, case-insensitive filtering is available. The tooltip for the header of this column will show the TRPL expression being used as the condition match for the report's results. |
| Conversion Support Level | No | This optional column describes the level of support in FWD for converting the associated 4GL language feature. Please see Understanding Support Levels to understand the meaning of the contents. If this column does not exist, it means that the AST nodes being matched in this report do not yet have gap analysis marking rules. |
| Runtime Support Level | No | This optional column describes the level of support in FWD for executing a converted version of the associated 4GL language feature. Please see Understanding Support Levels to understand the meaning of the contents. If this column does not exist, it means that the AST nodes being matched in this report do not yet have gap analysis marking rules. |
| Matches | Yes | The number of AST node matches for this category. |
| % | Yes | The percentage column just to the right of the Matches column is the category's matches / total matches expressed as a percentage. |
| Files | Yes | The number of files that have AST node matches for this category. |
| % | Yes | The percentage column just to the right of the Files column is the category's files with matches / total files with matches expressed as a percentage. |
Each Summary Report organizes the matches based on categories, one row per category. Jump to the Details Report for that category by clicking on the corresponding row of the Summary Report.
By default the table is sorted based on the number of matches, descending. The user can override the sorting using the up/down pointing triangles in the header of each column.
To improve performance, the number of categories shown at once is limited. For reports that have large numbers of categories, there will be multiple "pages" available via the pagination controls in the lower right corner of the Summary Report:
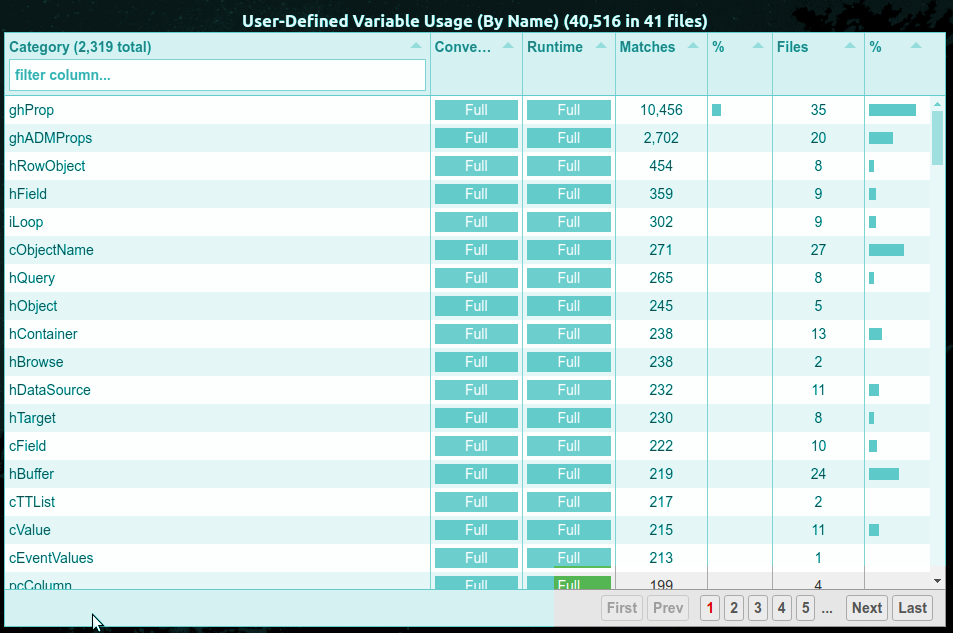
Use these controls to page through the categories. Using the Category name filtering in the header of the Category column is a very effective way to jump to a matching subset of the categories, if the category name has a simple case-insensitive text match.
There are a 2 non-standard Summary Reports in the Project Structure category. These reports are related to Lines of Code Analysis. These are special in that there is no matching Details Report for each row. The Lines of Code reports stand on their own. All other Summary Reports have a different Details Report for each Summary Report row (i.e. for each category).
Details Report
The Details Report will be loaded by clicking on the Category row of the Summary Report. When the Details Report loads, it replaces the content table of the "parent" Summary Report. It is loaded into that same space formerly occupied by the Summary Report contents.
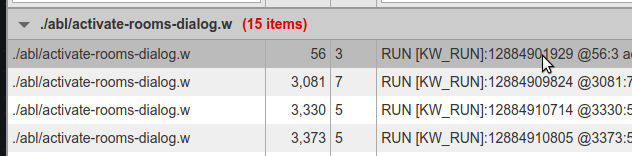
For example, while displaying the Language Statements report, clicking on the "run [KW_RUN]" category would load a Details Report showing all RUN statements. It will look something like this:
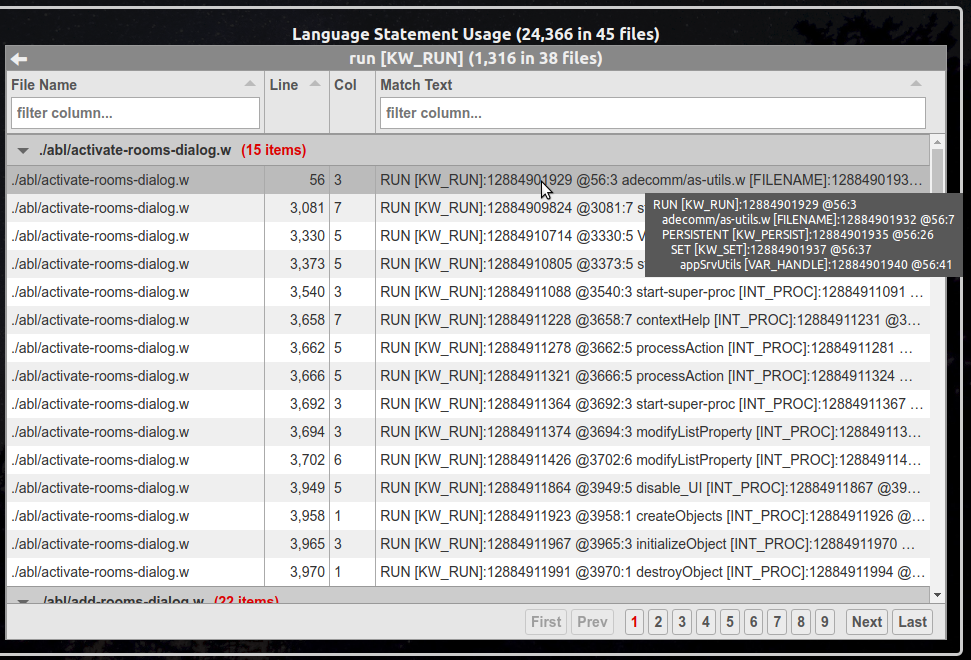
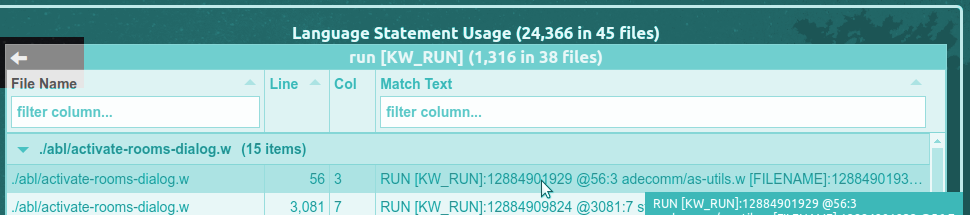
Notice that the parent Summary Report's title remains visible at the top, but the Details Report has been loaded where the Summary Report table was previously displayed.
The Details Report has a title of its own that is the category name from the Summary Report (e.g. "run [KW_RUN]") followed by the number of matches in the category (e.g. there are 1,316 RUN statements in the project) and the number of files that contained matches (e.g. 38 files had RUN statements).
Each match in the Details Report is a single row. That means that a row is specific to a specific AST node location in a single file (4GL code or schema). There are 4 columns in a Details Report:
| Column Name | Meaning |
|---|---|
| File Name | The file in which the match was found. |
| Line | The line number of the match in the file. This is the line number in the fully preprocessed "cache" file. It does NOT necessarily correspond to the line number in the external procedure, class or include file in which the code originated. See Reviewing the FWD Preprocessor Output and Line and Column Numbers in Preprocessor Artifacts for details. |
| Col | The column number on the specific line being referenced for this match. It does NOT necessarily correspond to the column number in the external procedure, class or include file in which the code originated. See Reviewing the FWD Preprocessor Output and Line and Column Numbers in Preprocessor Artifacts for details. |
| Match Text | Formatted text showing some useful information about the match. The content of this will vary by report. Some may be simple text from the source files and others will show a text rendering of a node or subtree from the AST. |
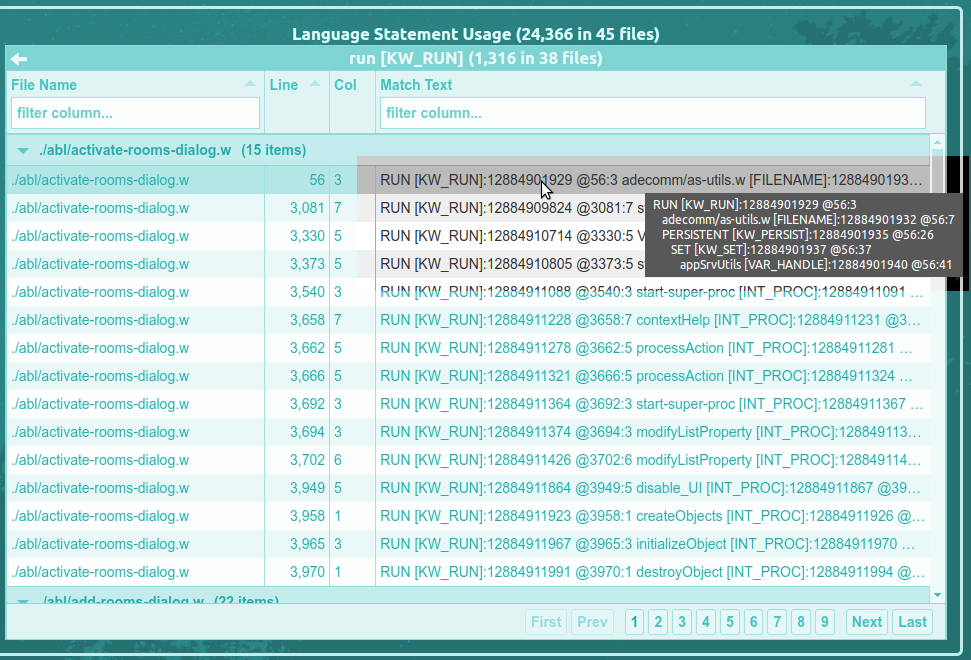
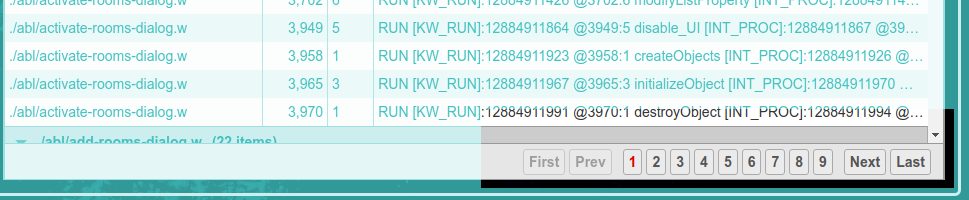
Hovering the mouse pointer over the Match Text cell of a specific row will show a tooltip with the a potentially larger, multi-line version of the Match Text:
Click on a row to display the Source View for the specific match being referenced. The Source View is a tool for reviewing and exploring the preprocessed source code (or schema) text and the associated AST.
Matches in the same file are grouped together and they may be collapsed or expanded as a group using the file-specific summary row. The number of matches in that specific file is displayed in red text (e.g. "15 items").
By default the table is sorted by file name, ascending and sub-sorted within each file name based on the match line number, ascending. The user can override the sorting using the up/down pointing triangles in the header of each column. The use of this for Line or Match Text columns may be a bit arbitrary and will probably not be too helpful. The result will still be grouped by file, but the order of the files will be sorted based on the column being used. Using the File Name column to sort will give some obvious utility.
To get back to the Summary Report, click on the left pointing arrow in the top left corner of the table:
![]()
It is common that a Details Report will have a very large number of matches (thousands or even millions). The total number of matches per page is limited for performance reasons. There are pagination navigation controls in the lower right corner that can be used to move between pages:
© 2004-2017 Golden Code Development Corporation. ALL RIGHTS RESERVED.