Source View
Introduction
The Source View is a tool for reviewing and exploring the preprocessed source code (or schema) text and the associated AST. Given an AST node anywhere in the application, the Source View can be loaded to allow viewing and exploration of that location.

There are 3 places in the Code Analytics tools from which the Source View can be loaded:
- In a Details Report, a click on a row with display the Source View for the specific match being referenced.
- In the call Graph Visualization, holding the SHIFT key down while clicking with the left mouse button on an AST-backed call-graph node will display the location of that AST node.
- Choosing the "Preprocessed" icon for a given file name in the Source File Listing will load the top of the preprocessed source file into the Source View. The AST portion won't be loaded until some part of the file that corresponds to an AST node is clicked.
On the left side is the Code Pane which displays the source code for the related file. On the right side is the AST Pane that displays the currently selected AST sub-tree for the AST node that is selected.
In the top center of the screen is the filename and a short description of the node that is currently selected.
The arrow at the left is a kind of "back button" that is used to return to the screen from which this was loaded. DO NOT use the browser's back button. It will not work to navigate inside the Code Analytics application.
Code Pane (Left Side)
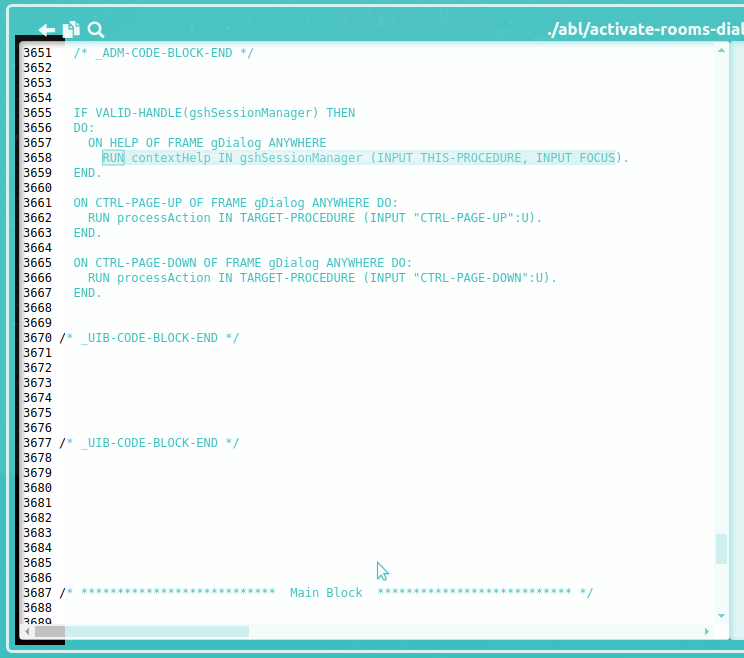
The left side of the Source View is called the Code Pane and it displays:
- The source code text (fully preprocessed) of a single external procedure or class; OR
- The schema definition as text from a
.dffile or the source code text for the matchingDEFINE TEMP-TABLEorDEFINE WORK-TABLEstatement.
For source files, the code displayed is the fully preprocessed version (a.k.a. the .cache file).
Line Numbers and Source Text
The numbers on the far left are line numbers. Since the source code shown is the preprocessed version, any expansions or reductions in the code (e.g. a non-empty include file or a preprocessor &if directive) will cause the line numbers to be different from the original source file. This is the source code as the FWD conversion will see it or as the OpenEdge 4GL compiler will process it.
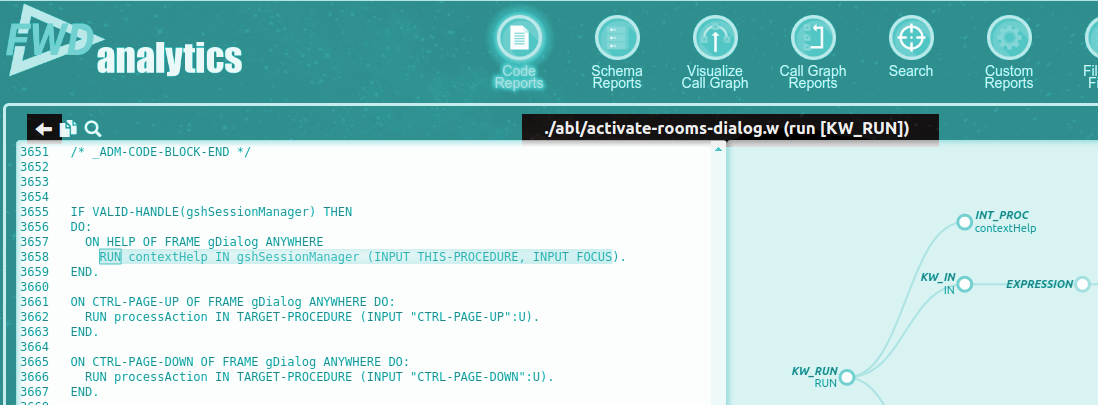
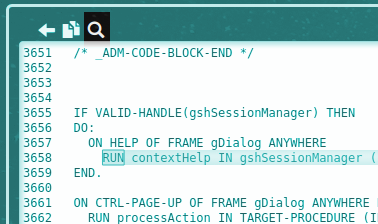
In this example, the line numbers and text displayed correspond with the ./abl/activate-rooms-dialog.w.cache.
A future enhancement will allow the specific include file to be determined for each character in the cache file. This information is recorded in the ./<source_path>/<filename>.pphints file and it simply hasn't been integrated in this view yet.
Please see Preprocessing Chapter, Techniques section to understand how to map the cache file line number back to the original source file and line.
Navigating
On the right side of the Code Pane is a vertical scrollbar and on the bottom there is a horizontal scrollbar. These allow navigation throughout the entire file.
Using the mouse wheel on this view will scroll up or down as one might expect.
Highlighted Source Code
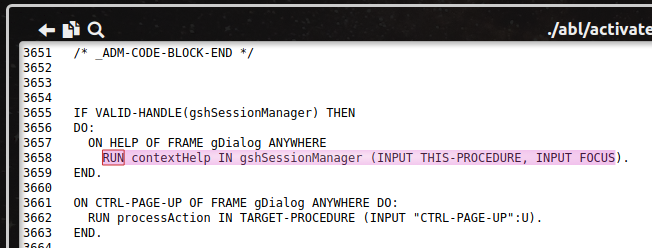
Of the three ways to get to this screen, two of them identify a specific AST node which is being displayed. This means that clicking on a specific entry in a Details Report or on an AST node in the Call Graph Visualization will load the Source View and associate the visible contents with the AST node that was selected in the prior view. This can be thought of as the "initial selection".
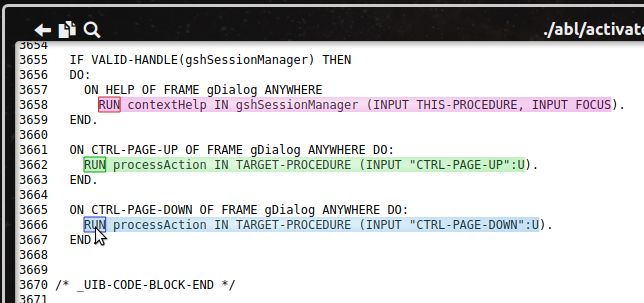
The contents of the Code Pane will be scrolled to the code associated with that AST. There will be a magenta highlight for that code. The text for the specific node will be drawn boxed with a slightly darker color and the text associated with the rest of the sub-tree is highlighted without a border. This highlight will stay around even when other AST nodes are selected.
Entry to the screen from the Source File Listing page has no AST associate with it and thus it will have no magenta highlight (and it will be positioned at the top of the file).
A left mouse click on text in the source that corresponds to AST nodes will cause a green highlight for that node and the sub-tree of nodes rooted at that node. The text for the specific node will be drawn boxed with a slightly darker color and the text associated with the rest of the sub-tree is highlighted without a border. This highlight will stay around until a different AST node is selected via the mouse.
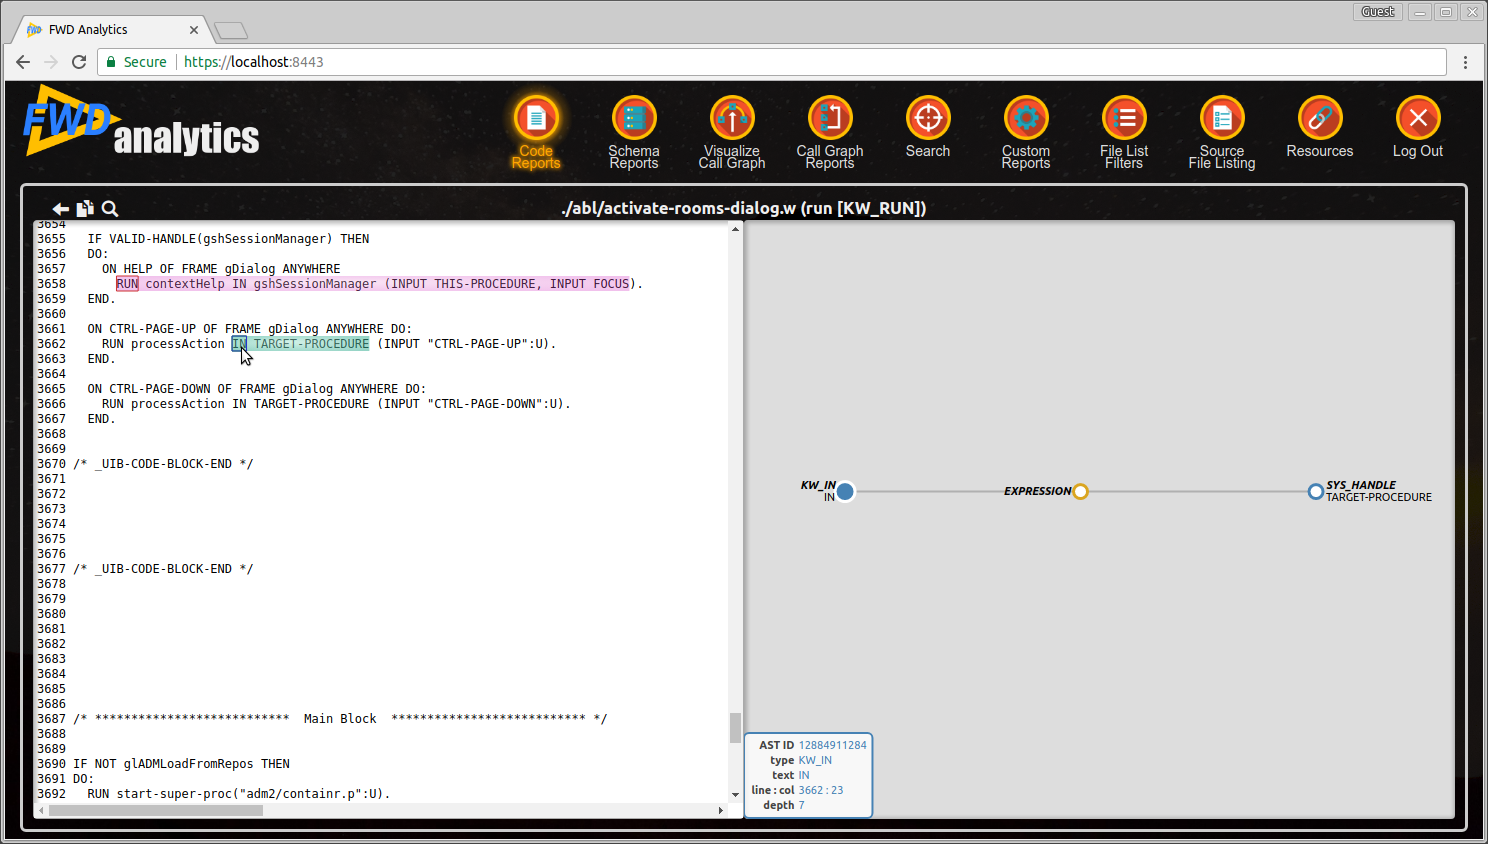
This green highlight can be thought of as the current selection, except it does not exist when the user first enters the screen. This selection action will also change the AST that is shown on the right side AST Pane. The AST sub-tree that is shown will match any green highlighted current selection OR on entry it will match the initial selection.
Likewise certain actions in the AST Pane can change the current selection and this will be displayed in the Code Pane. See below for more details.
Mouse Hover Over Text
If source text in the Code Pane is associated with an AST node, hovering the mouse over that text will cause that node and any sub-tree nodes to be highlighted in blue. The sub-tree root node is boxed with a slightly darker color and the rest of the sub-tree is highlighted without a border.
This same blue highlight will occur when the mouse hovers over an AST node on the right side, except it will be highlighting something in the current selection (or the initial selection if there is no current selection).
If the mouse hover occurs on the left side over the current selection (or the initial selection if there is no current selection), then the associated node in the AST Pane will be highlighted and a details display of node data will be shown.
See below for more details.
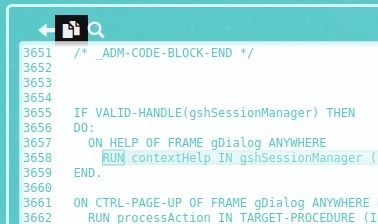
Copy to Clipboard
When the copy button is clicked, the entire fully preprocessed source file (the entire .cache file) will be copied to the system clipboard.
For most browsers, the following dialog will appear.

This is needed because of security restrictions that most browsers implement, to disallow direct Javascript writing of the system clipboard. The user's use of CTRL-C in this dialog confirms for the browser that the user intends for the text to be written to the system clipboard and thus there is no security issue.
It is possible to swipe with the left mouse and select text in the Code Pane. Then a right mouse click to bring up a context menu and selection of Copy will copy the selected text to the system clipboard. Using this is limited to text that is currently displayed on the screen. Although it seems as if one can select all text in the file (by swiping down "long enough"), only the currently visible selected text will be copied. This is why the copy button was added to the toolbar.
Search
Using the built-in Find feature of the browser will not work to search the full source text of the file. This is because the text is being rendered using a special graphic Javascript implementation and the entire source file is never loaded at any one time. For this reason a search button as been provided:
Click on the search button and it will change into this Find prompt:
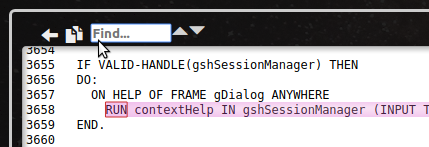
Type any text into the prompt and click down or up to search in that direction. The text searching is done on a case insensitive basis. The currently matched search result will display with a peach colored highlight with no border box:
Searching up from the top of the file (or from the first match) will wrap to the bottom of the file and show the last match. Search down past the last match or past the end of the file and it will wrap back to the start of the file and show the first match. The number of matches and the index being shown are displayed to the right of the up/down buttons.
AST Pane (Right Side)
When first entered, the AST Pane will display a sub-tree that corresponds with the magenta colored initial selection in the Code Pane. Subsequent left-clicks in the Code Pane may change the current selection (and the code in the green highlight in the Code Pane), which will lead to the AST Pane displaying a different sub-tree.
Understanding the AST Display
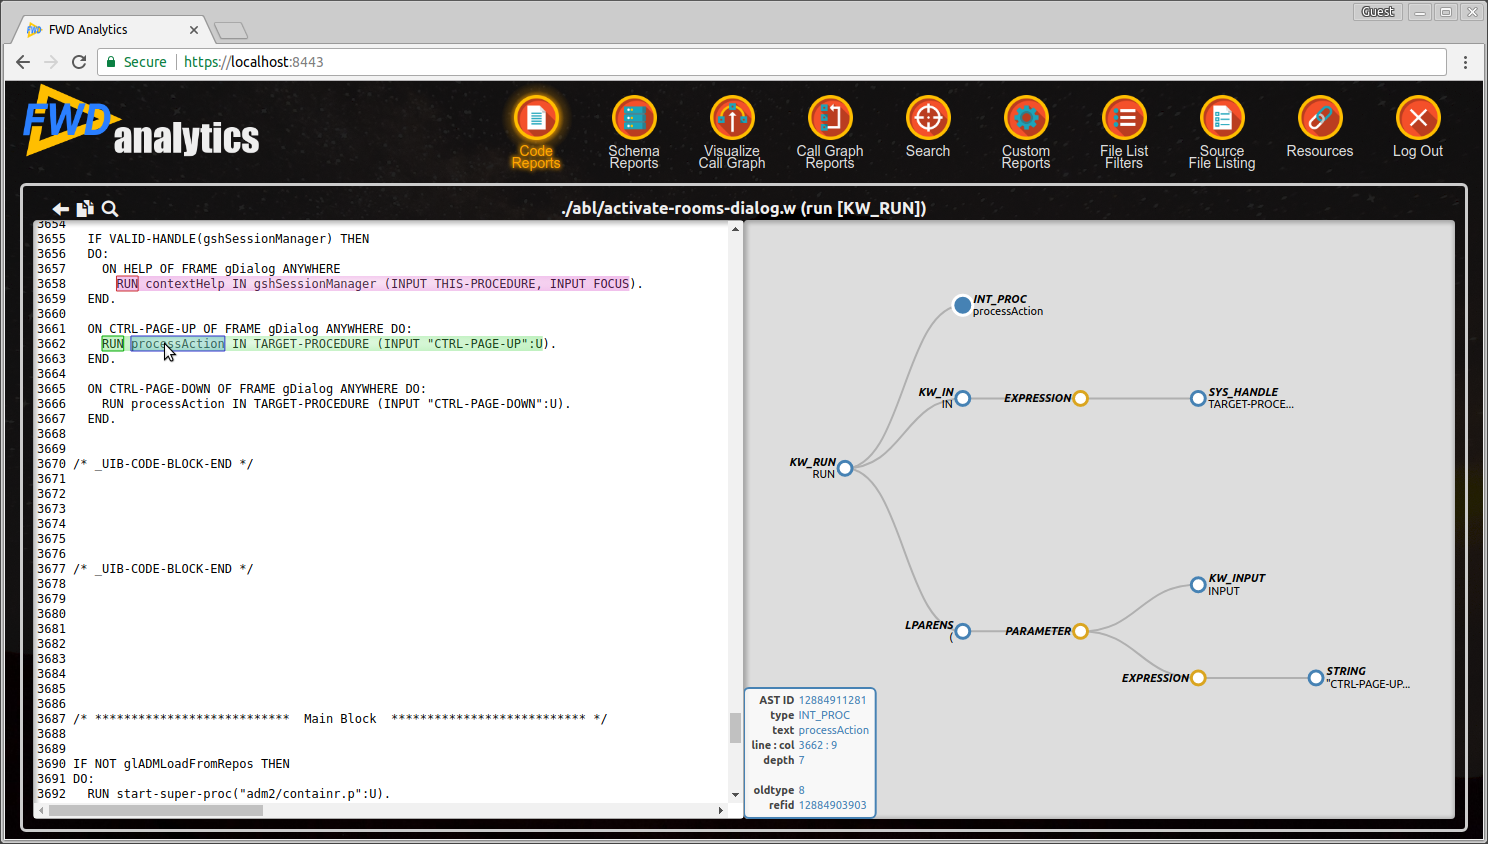
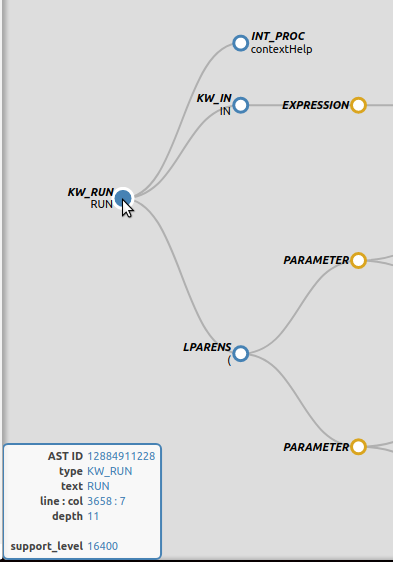
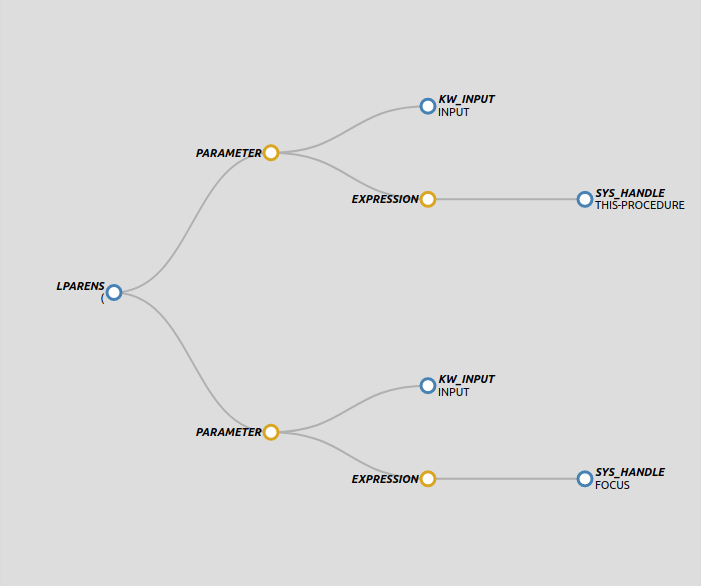
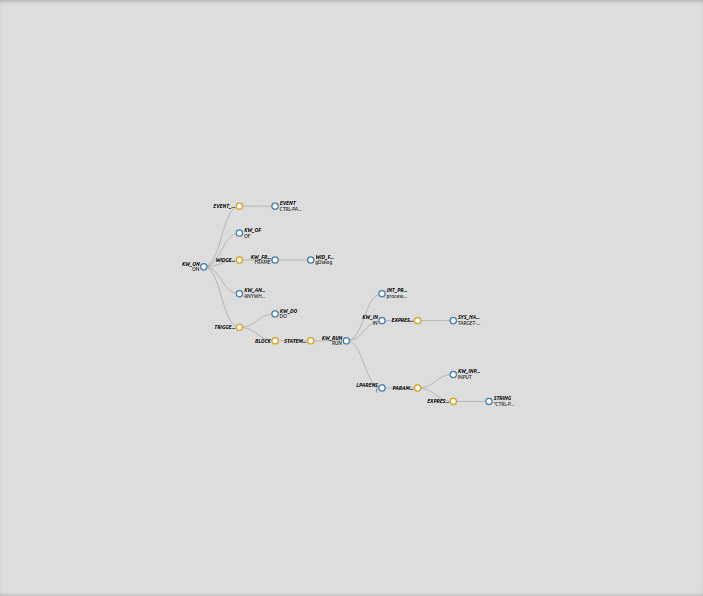
Consider the following 4GL code:
RUN contextHelp IN gshSessionManager (INPUT THIS-PROCEDURE, INPUT FOCUS).
This is just one line of code of hundreds or thousands in a given file. When the entire program is parsed into AST form, there will be a branch of the tree that is created from this line of code. The branch is considered a sub-tree that is rooted at an AST node associated with the text RUN. The rest of the language statement is represented as child nodes, grand-child nodes as so forth as needed to reflect the structure of the statement.
When the associated AST sub-tree is displayed in the AST Pane, it will look like this:
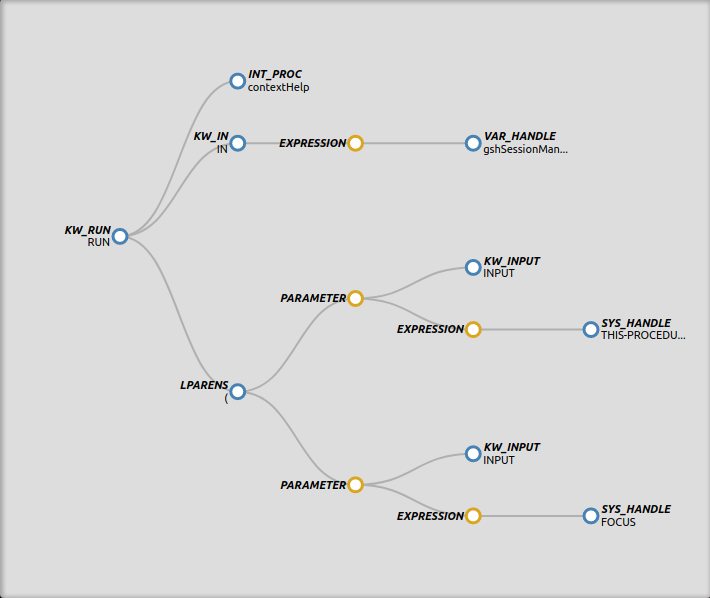
Each AST node is displayed as a circle. Parent/child relationships are represented with a black line connecting the parent (left side node) to the child (right side node).
A blue circle is a node that is directly associated with specific text in the cache file. There will always be the following minimum data in such nodes:
- Token Type as an integer constant that has a symbolic representation. This symbolic name will be displayed in bold text next to the node's circle. Each token type is a unique integer which means that programs can easily be written to differentiate between the nodes based on their type. All of these are defined in
com.goldencode.p2j.uast.progress.g. See this list of the latest token type symbolic constants. Examples:KW_RUNis the symbolic name for theRUNkeyword. All keywords have a name starting withKW_and followed by up to 8 other characters.INT_PROCis the symbolic constant that represents an internal procedure reference.VAR_HANDLEis a variable reference of type handle.
- Token Text is the original text as parsed from the source code. It is usually unmodified from the original code. It is displayed in a regular font, just below the token type name. If it is too long to fully display, it may be displayed with
...(ellipses). Examples:RUNis the text for theKW_RUNnode in this case.contextHelpis the internal procedure name being referenced by theINT_PROCnode.gshSessionManageris the name of the variable of type handle that is referenced by theVAR_HANDLEnode.
- A non-zero line number of the cache file starting line from which this code was parsed. This is not displayed in the graphical rendering of the sub-tree, but it can be seen in the details panel (see below).
- A non-zero column number of the cache file starting column from which this code was parsed. This is not displayed in the graphical rendering of the sub-tree, but it can be seen in the details panel (see below).
- AST ID which is a 64-bit integer that uniquely identifies this node across the entire project. The upper 32-bits is the file ID which is common to all nodes in the same AST. The lower 32-bits is the specific portion that is unique to the node. This is not displayed in the graphical rendering of the sub-tree, but it can be seen in the details panel (see below).
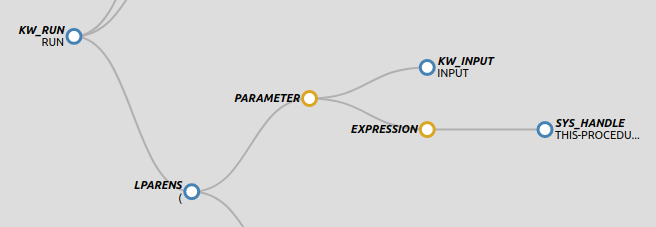
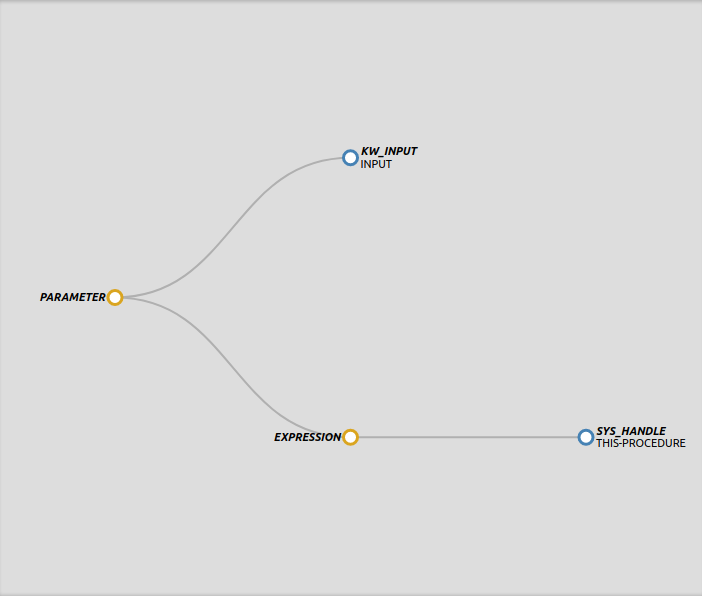
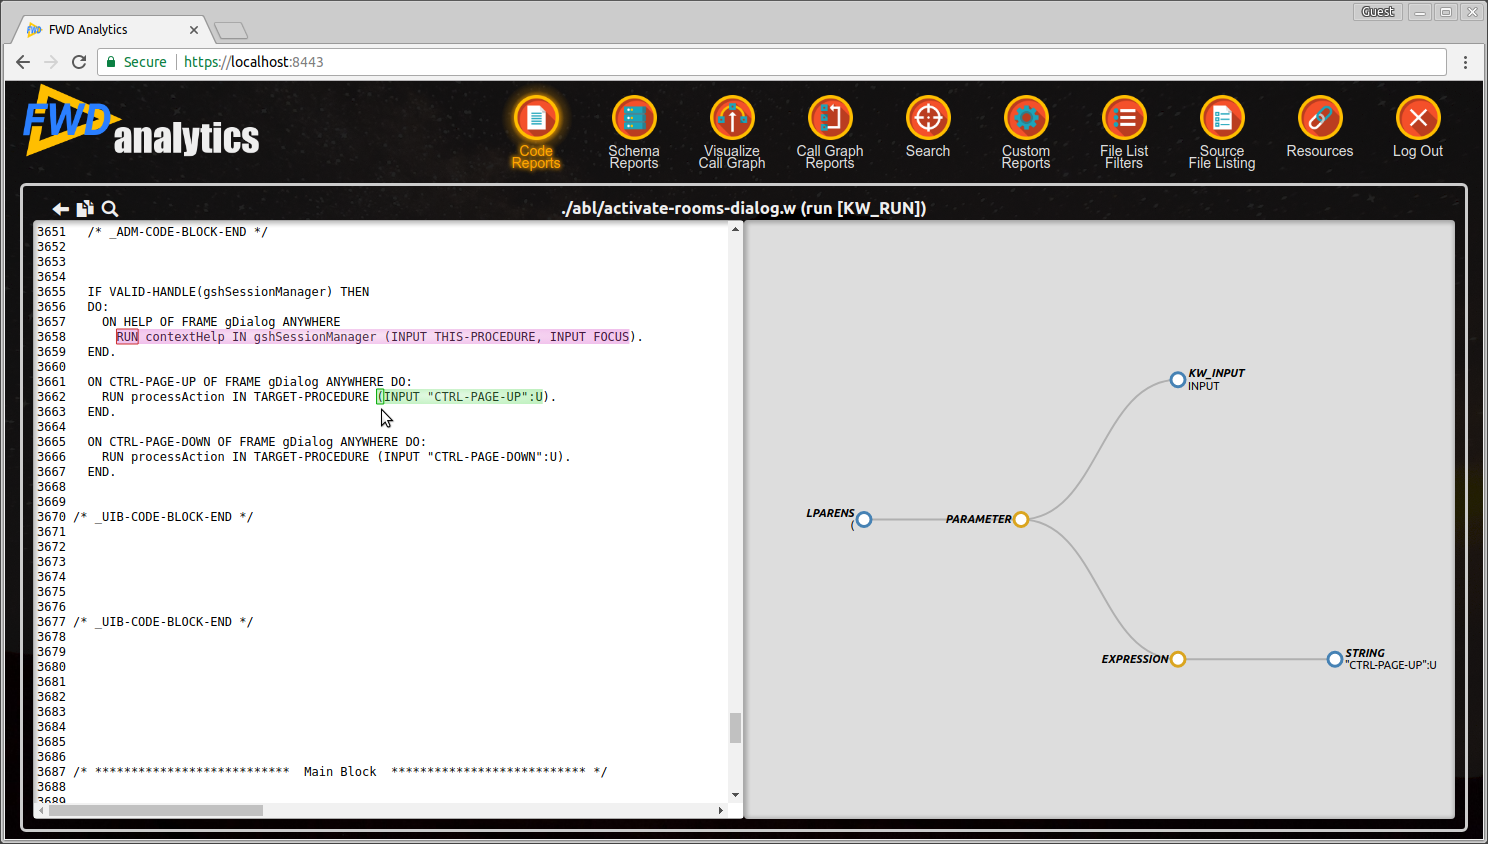
A yellow circle is a node that is "artificial" which means the parser created it to provide some useful structure in the tree but there is no specific text from the source code that is associated with it. There will be the following minimum data in such nodes:
- Token Type as described above. The artificial nodes have types too. Examples:
EXPRESSIONis the symbolic name for a node that parents an arbitrary expression sub-tree.PARAMETERis the symbolic name for a node that parents each parameter to a function call or internal procedure invocation.
- Token Text is optional and often does not exist.
- Line number set to 0. This is not displayed in the graphical rendering of the sub-tree, but it can be seen in the details panel (see below).
- Column number set to 0. This is not displayed in the graphical rendering of the sub-tree, but it can be seen in the details panel (see below).
- AST ID which is a 64-bit integer that uniquely identifies this node across the entire project. The upper 32-bits is the file ID which is common to all nodes in the same AST. The lower 32-bits is the specific portion that is unique to the node. This is not displayed in the graphical rendering of the sub-tree, but it can be seen in the details panel (see below).
All nodes will often have "annotations" which are arbitrary typed data that are stored in a node. The annotations a node has are usually specific to the token type of the node and they store a great deal of additional information about the node. For example, a FIELD_CHAR node is a field reference of character type and it will have an annotation called schemaname that is the fully qualified name of the field (in database.table.field format).
The leftmost node is the root node of the sub-tree being displayed. In most cases it is NOT the root node of the entire program. Because there can be tends of thousands of AST nodes in a single program's abstract syntax tree, displaying the entire tree is usually not a useful thing to do. For this reason, the AST Pane defaults to only displaying the sub-tree rooted at the topmost node of the current selection.
Child nodes are on the right connected via a black colored arc or line to their parent node on the left. There can be 0 or more child nodes to every parent node. All child nodes must have one and only one parent, except for the root node of the entire program which is the only node in the tree without an parent.
Child nodes have an very specific order. Within a given parent node, the child node closest to the top of the screen is the first child (index 0), the next one lower is the second child (index 1) and so forth.
Hover
Hovering the mouse over a node will yield the following results:
- The colors of the node will be inverted. For example, a node with a blue circle with white fill will become a white circle with blue fill.
- The node will be slightly enlarged in size.
- A small panel with node details will be displayed in the lower right corner of the AST Pane.
- If the current selection (which matches the displayed AST sub-tree) is visible in the Code Pane, then the text associated with the AST node (and its sub-tree) will get a blue highlight.
The same results will occur if the mouse hover occurs on the Code Pane over the current selection (or the initial selection if there is no current selection). In this case the associated node in the AST Pane will be highlighted and a details display of node data will be shown as described above.
Collapse and Expand
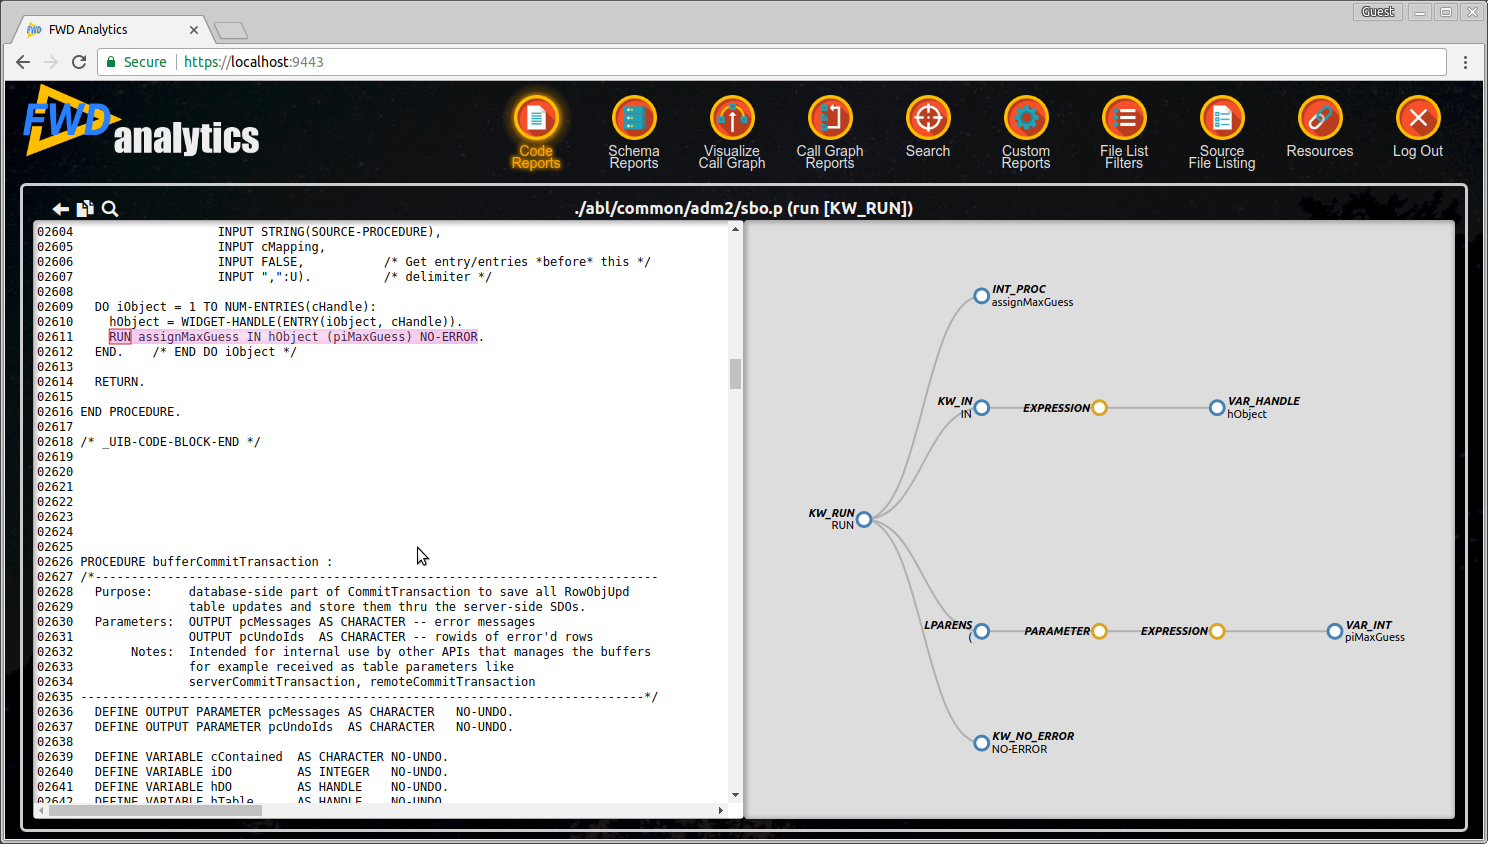
Left click on an AST node collapses any visible child nodes. Starting with this:
A left click on the PARAMETER node yields this:
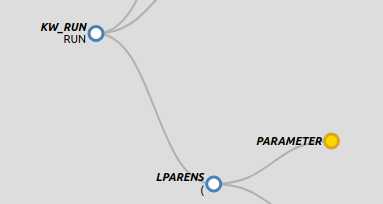
Collapsed nodes have a darker border and a matching colored fill to denote the hidden children. Left clicking on this node again will expand the invisible child nodes, making them visible again.
Navigating the Tree
ctrl-left-click on a node makes it the root node of the view. This allows "walking down" the tree, displaying less of it.
shift-left-click on a node makes the parent of the clicked node the new root node of the view, this allows "walking up" the tree visually, displaying more of the tree.
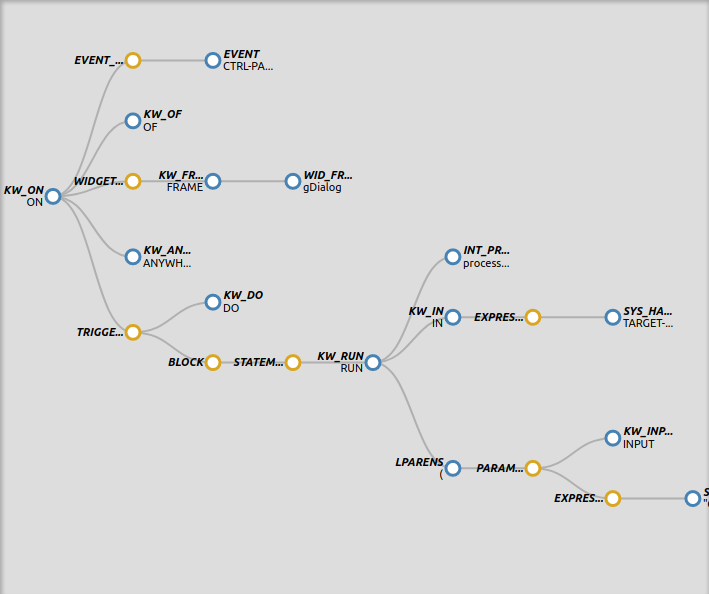
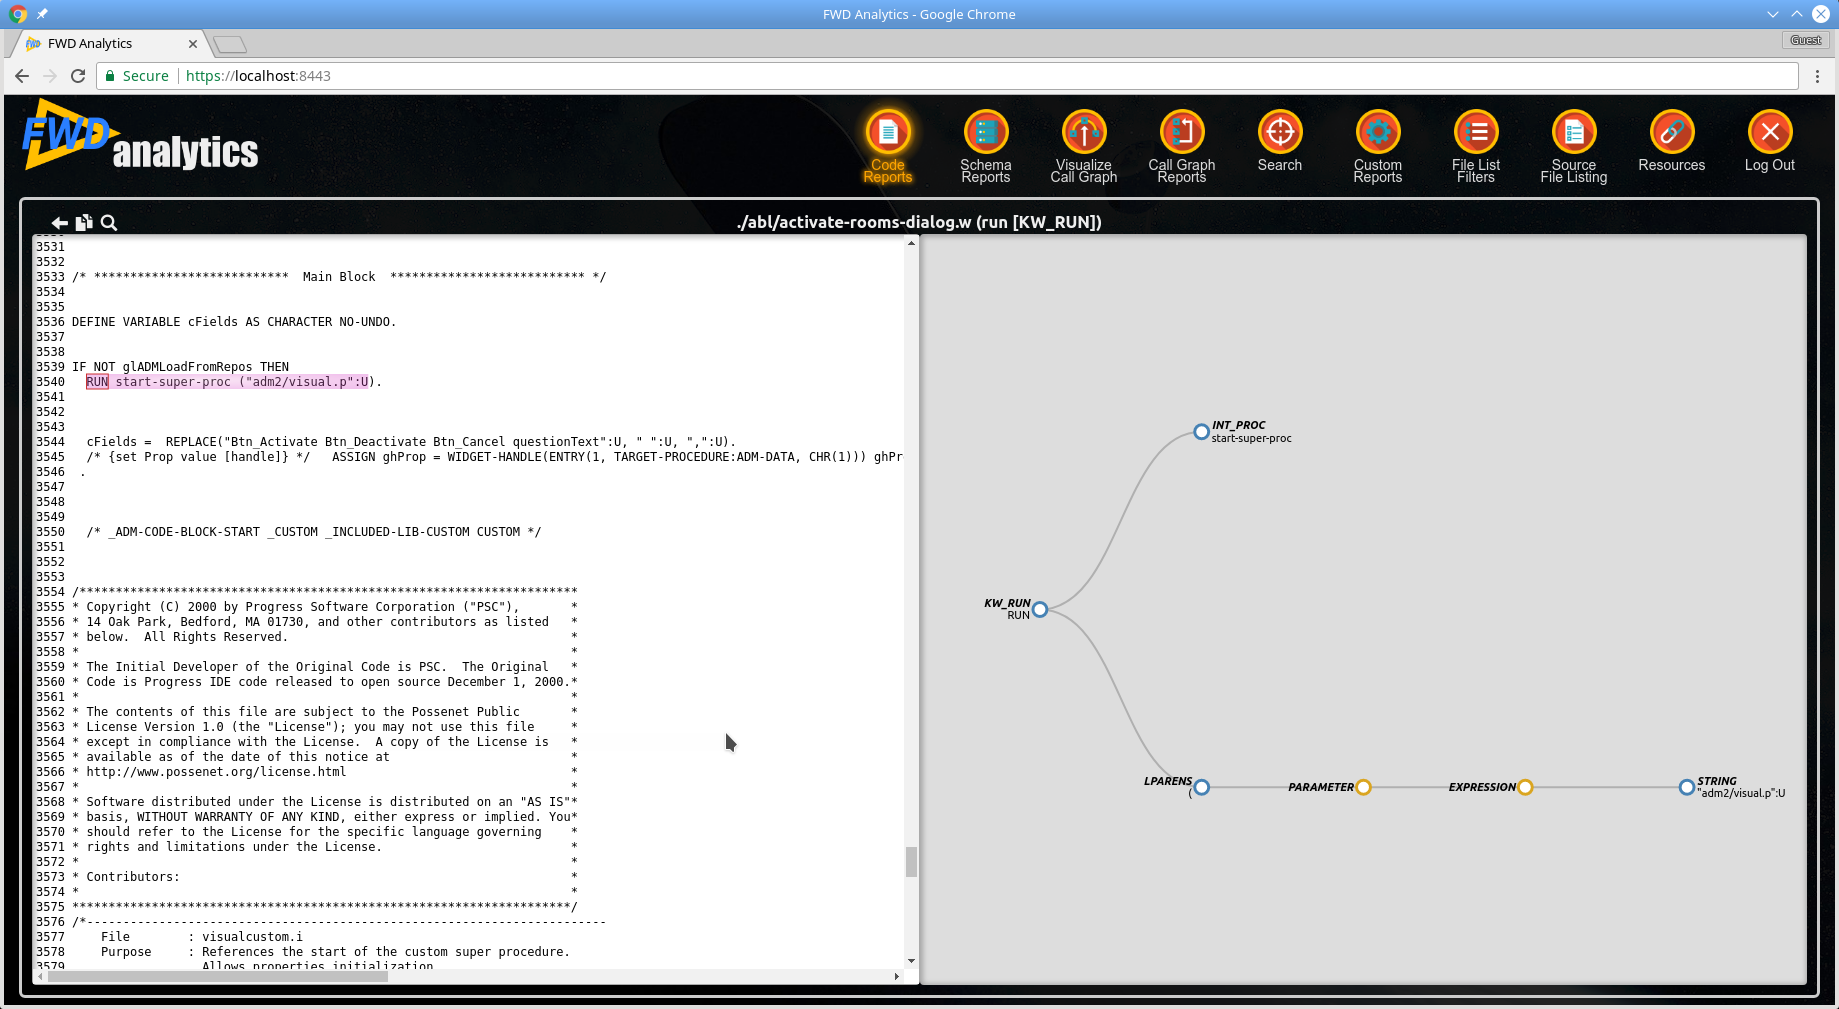
Given this starting point:
Using ctrl-left-click on the first PARAMETER child of the LPARENS node will result in this:
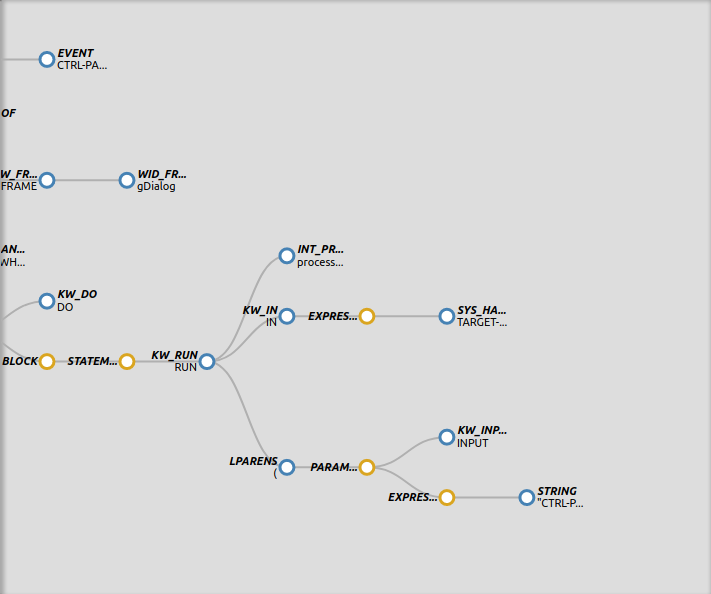
From here, using shift-left-click on the first PARAMETER sub-tree root will cause that node's parent LPARENS node to be the new sub-tree root:
In this way, the currently displayed sub-tree can be changed to show more or less of the overall AST.
When either the shift-click or ctrl-click occurs, it will change the current selection in the Code Pane to match. This will be highlighted in green.
Zoom and Pan
While the mouse pointer is anywhere over the AST Pane, using the mouse-wheel to scroll up will zoom in (enlarging the view) and scrolling down will zoom out (shrinking the view). This is useful for visualizing more of the tree when there are many nodes, or focusing in on part of that tree.
Dragging (hold down left button and move the mouse) the AST Pane will move the content of the view. This is useful when content is off screen which can happen when larger sub-trees are displayed.
Default size:
Panned to the left:
Zoom in example:
Zoom out example:
In all of these cases, note that the size of the AST Pane is unchanged. It is the relative size of the content (zoom) and the position of the content (panning) that is changing.
You can zoom in after panning and pan after zooming. All of the various visual transforms are applied on top of the other.
No matter the size or position, this is not just a static image of the tree. The tree is "live" and all of the other navigation, selection and control features will continue to work.
Bidirectional Link Between Code Pane and AST Pane
The Code Pane and the AST Pane are linked together such that whenever a selection of an AST node is made, the content of both panes will be synchronized.
For example, on first entry to the screen from a source that specifies the selected AST, the initial selection is displayed in both panes:
In this example, the user clicked on a row from a Details Report and the associated RUN statement is highlighted in magenta (the initial selection) in the Code Pane. The AST node associated with the RUN is the KW_RUN token type and it is the root of a sub-tree that corresponds to the highlighted text in the Code Pane. This sub-tree is displayed in the AST Pane.
Not all text in the Code Pane match an AST node. Comments, whitespace and "syntactic sugar" (text that appears in the source code but is not needed in the tree-structure form of the code) are displayed but not linked. When the user clicks on text in the Code Pane that does match an AST node, a current selection is made (green highlight) and the AST sub-tree that matches that current selection is displayed in the AST Pane.
When a new sub-tree root node is displayed in the AST Pane, the Code Pane will show the related source code and that code will be highlighted in green. This can happen by using shift-left-click or ctrl-left-click to traverse up or down (respectively) the tree.
Finally, any mouse hovering over linked text/AST nodes in either the Code Pane or the AST Pane will highlight the matching text/AST node in the other Pane, so long as the matching text or AST nodes are visible.
© 2004-2017 Golden Code Development Corporation. ALL RIGHTS RESERVED.