Feature #6813
analyze and improve performance of dynamic conversion of temp-tables and queries
80%
Related issues
History
#1 Updated by Constantin Asofiei almost 4 years ago
- parser (including AnnotatedAst APIs)
- TRPL engine
- reduce the number of TRPL rules being ran
#2 Updated by Constantin Asofiei almost 4 years ago
Some changes are in 3821c/14272. Greg, please review.
#3 Updated by Constantin Asofiei almost 4 years ago
- Avoid reflection when creating a new instance, in AnnotatedAst - added 'newInstance' method.
- For the 'create' TRPL API, cache the resolved constructor, based on the arguments signature.
- When processing TRPL rules, avoid using iterators on ArrayList - instead, use a 'for' loop and get the element by index, as iterators are more expensive in terms of memory and performance.
#4 Updated by Constantin Asofiei over 3 years ago
Improvements need to be made to dynamic query interpreter, too. It takes ~280ms for 6500 'interpret' calls.
#5 Updated by Ovidiu Maxiniuc over 3 years ago
Do you have a statistic of where is the most time consumed?
Usually the AST tree is simple enough and there are only a couple level depth. I assume the most time consuming are (with the expected time slice in percents):- resolving variables/buffers
Map.get()- 10% - resolving methods (deciding which methods to call based on their arguments type) - 40%
- effective calls to queries or other methods which are the same as the compiled version and cannot improved here - 50%
In both first cases, annotations are used for caching already computed information like the value of constants in first case or the signature of the method to be called. Executing a 'heating' test-set should prepare the AST trees for better performance in subsequent runs (unless they are not dropped because of cache constraints).
If your profiling reveal something we can try to improve the above pieces of code.
#6 Updated by Constantin Asofiei over 3 years ago
interpret, into the application (via ControlFlowOps). Most of the time is being spent in callMethod, which includes:
- 34% of the time in Utils.invoke, with ~80% of the time spent in i.e.
p2j.persist.PreselectQuery.initialize - (almost all) the rest of the time is spent in
collectParameterswhich callsevalExpression, with ~20% of the time inAnnotatedAst.isAnnotation
callMethod is being executed ~24k times.
#7 Updated by Ovidiu Maxiniuc over 3 years ago
Constantin Asofiei wrote:
Improvements need to be made to dynamic query interpreter, too. It takes ~280ms for 6500 'interpret' calls.
I do not know how exactly to interpret this. How does this compare to compiled version of the same query?
#8 Updated by Ovidiu Maxiniuc over 3 years ago
Constantin Asofiei wrote:
Ovidiu, I don't see any calls originating frominterpret, into the application (via ControlFlowOps). Most of the time is being spent incallMethod, which includes:
- 34% of the time in Utils.invoke, with ~80% of the time spent in i.e.
p2j.persist.PreselectQuery.initialize
Can we short cut the Utils.invoke and call directly PreselectQuery.initialize()? There are 18 overloaded variants.
- (almost all) the rest of the time is spent in
collectParameterswhich callsevalExpression, with ~20% of the time inAnnotatedAst.isAnnotation
Yes, as expected. we need to resolve and evaluate the parameters to know which method to invoke. The evalExpression() starts with with a check for a cached runtime-value annotation, in which case the value is returned. If found, the value is returned so, since this is the only code executed, the percent of isAnnotation is reasonable. Can we improve it? Like replacing the annotation with a member for direct access? I am thinking of a specialized AST (JavaAst) with runtime annotations as members instead. No more access using Map structure.
callMethodis being executed ~24k times.
I do not think we can reduce that.
#9 Updated by Constantin Asofiei over 3 years ago
Ovidiu, the problem is when the query predicate for the dynamic query is really unique (think a UUID is used as an operand). I wrote a test which executes 10k static and dynamic queries (in a Java FOR block, so any RUN processing does not interfere), the blocks looks like this:
         int n = 10000;
         Random r = new Random(System.currentTimeMillis());
         long l1 = System.nanoTime();
         for (int i = 0; i < n; i++)
         {
            query0 = new QueryWrapper("q", false);
            query0.addBuffer(tt1, true);
            query0.addBuffer(tt2, true);
            query0.assign(new CompoundQuery().initialize(true, false));
            query0.addComponent(new AdaptiveQuery().initialize(tt1, ((String) null), null, "tt1.recid asc"));
            query0.addComponent(new AdaptiveQuery().initialize(tt2, "tt2.f2 = ? and ? = tt2.f2", null, "tt2.recid asc", new Object[]
            {
               i * (r.nextInt(10000) + 1),
               new FieldReference(tt1, "f1")
            }));
            query0.open();
            query0.close();
         }

         long l2 = System.nanoTime();
         System.out.println((l2 - l1) / 1000000d);

         l1 = System.nanoTime();
         for (int i = 0; i < n; i++)
         {
            hq = UndoableFactory.handle();
            QueryWrapper.createQuery(hq);
            hq.unwrapBufferCollection().addBuffer(new handle(buffer(tt1)));
            hq.unwrapBufferCollection().addBuffer(new handle(buffer(tt2)));
            hq.unwrapQuery().prepare(concat("for each tt1, each tt2 where tt2.f2 = ", valueOf(i * (r.nextInt(10000) + 1)), " and tt1.f1 = tt2.f2"));
            hq.unwrapQuery().queryOpen();
            HandleOps.delete(hq);
         }
         l2 = System.nanoTime();
         System.out.println((l2 - l1) / 1000000d);
In OE, the same code (including RUN), executes in 26ms for static query and 210ms for dynamic queries.
In FWD, the times are:
Run 1: 108.900789 and 1318.27071
Run 2: 46.487962 and 681.405206
Run 3: 46.355109 and 600.647235
The dynamic case is 3-6 times slower than OE, and the static case 2-5 times slower. I added the 'random' to make the queries (mostly) unique, because I was puzzled why second (and subsequent) runs were taking 40-50ms for the dynamic case.
So, the problem is when the query predicates are unique. Both temp-tables are empty, no results are being returned by JDBC. I don't yet understand why in FWD, for the second run, the time is 46ms for the static query case.
#10 Updated by Greg Shah over 3 years ago
I am thinking of a specialized AST (JavaAst) with runtime annotations as members instead. No more access using Map structure.
A subclass of JavaAst could be implemented.
#11 Updated by Ovidiu Maxiniuc over 3 years ago
Constantin Asofiei wrote:
The dynamic case is 3-6 times slower than OE, and the static case 2-5 times slower. I added the 'random' to make the queries (mostly) unique, because I was puzzled why second (and subsequent) runs were taking 40-50ms for the dynamic case.
So, the problem is when the query predicates are unique. Both temp-tables are empty, no results are being returned by JDBC. I don't yet understand why in FWD, for the second run, the time is 46ms for the static query case.
The engine for dynamic queries will replace the inlined values with parameters. So all concat("for each tt1, each tt2 where tt2.f2 = ", valueOf(i * (r.nextInt(10000) + 1)), " and tt1.f1 = tt2.f2") should actually use the very same AST tree. At least this is in theory.
See DynamicQueryHelper.extractParams(). It looks for nodes annotated with is-literal and replaces them with a variable, "hqlParam<i>dq" and stores the hardcoded value as default value. In this case, the valueOf() should be converted as literal and hence replaced by a variable so that subsequent queries will use the same tree.
#12 Updated by Constantin Asofiei over 3 years ago
Ovidiu Maxiniuc wrote:
The engine for dynamic queries will replace the inlined values with parameters. So all
concat("for each tt1, each tt2 where tt2.f2 = ", valueOf(i * (r.nextInt(10000) + 1)), " and tt1.f1 = tt2.f2")should actually use the very same AST tree. At least this is in theory.
I understand this, that's why level1 cache will use the exact query predicate - but if the literals don't match, it goes through parsing, prepare, etc, although it will avoid the JAST processing, as this exists in level2 cache.
So the first pass can be on the 'level1' parsing:- the query parse (via progress.g)
- any additional processing on the ProgressAst (.p2o, etc)
- the query interpret
#13 Updated by Ovidiu Maxiniuc over 3 years ago
That is correct.
I see that there are 2 buffers involved so there is a bit of initialization and maybe some optimizations attempts.
But it is strange that the static case takes comparable amount of time (46ms) with the interpreted variant (40-50ms).
#14 Updated by Constantin Asofiei over 3 years ago
Ovidiu Maxiniuc wrote:
That is correct.
I see that there are 2 buffers involved so there is a bit of initialization and maybe some optimizations attempts.But it is strange that the static case takes comparable amount of time (46ms) with the interpreted variant (40-50ms).
First value is static case (46ms), second value is dynamic (680-1300 ms).
#15 Updated by Ovidiu Maxiniuc over 3 years ago
OK, I understand now. If the ASTs are found in cache, the time "was 40-50ms for dynamic case" which is pretty close to static case. So you made them unique so now FWD parses the queries each time which adds the extra 5-600ms. This is when it gets lucky and finds the query in cache1. In the worse case scenario (first run) it needs an additional 6-700ms to process.
In this case I think we should improve the parsing and TRPL processing.
Since the dynamic case use the same parametrized SQL statement for all 10000 iterations, it might get faster responses from SQL server than in static conversion where the statements must be reprocessed each time on database side.
Please let me know if I get it wrong.
#16 Updated by Constantin Asofiei over 3 years ago
Ovidiu Maxiniuc wrote:
OK, I understand now. If the ASTs are found in cache, the time "was 40-50ms for dynamic case" which is pretty close to static case.
Exactly, if the query predicate is found in level1 cache, then is pretty close to static case.
So you made them unique so now FWD parses the queries each time which adds the extra 5-600ms. This is when it gets lucky and finds the query in cache1. In the worse case scenario (first run) it needs an additional 6-700ms to process.
Correct.
In this case I think we should improve the parsing
Yes, this is what I meant by 'first pass' for level1 processing in #6183-12
and TRPL processing.
TRPL is reached only if level2 cache doesn't have the JavaAst.
Since the dynamic case use the same parametrized SQL statement for all 10000 iterations, it might get faster responses from SQL server than in static conversion where the statements must be reprocessed each time on database side.
Possible, I didn't check.
#18 Updated by Ovidiu Maxiniuc over 3 years ago
- Assignee set to Ovidiu Maxiniuc
- Status changed from New to WIP
I used the following 4GL program in order to replicate Constantin's testcase for static/dynamic queries:
output to "\tmp\query-times.txt".

define temp-table tt1
   field f1 as int
   field f2 as int.

define temp-table tt2
   field f1 as int
   field f2 as int.

define variable N as integer init 10000.
define variable k as integer.
define variable i as integer.
define variable hq as handle.
define variable dt1 as integer.
define variable dt2 as integer.

k = 1.
do while k le 3:
   etime(true).
   i = 0.
   do while i lt N:
      define query q for tt1, tt2.
      open query q for
         each tt1,
         each tt2 where tt2.f2 = i and tt1.f1 = tt2.f2.

      close query q.
      i = i + 1.
   end.
   dt1 = etime.

   etime(true).
   i = 0.
   do while i lt N:
      create query hq.
      hq:set-buffers(buffer tt1:handle, buffer tt2:handle).
      hq:query-prepare("for each tt1, each tt2 where tt2.f2 = " + string(i) + " and tt1.f1 = tt2.f2").
      hq:query-open().
      hq:query-close().
      delete object hq.
      i = i + 1.
   end.
   dt2 = etime.

   message "Run " + string(k) + ":" dt1 "and" dt2.
   k = k + 1.
end.
My result were:
| Native OE | FWD |
|---|---|
Run 1: 70 and 462 Run 2: 42 and 460 Run 3: 42 and 461 |
Run 1: 223 and 6253 Run 2: 177 and 292 Run 3: 115 and 188 |
- the static queries performed 3x slower on FWD than OE. Result are consistent in all 3 rounds, including the first cold run;
- in the dynamic case the first (cold) run is awful 12x slower because of the amount of parsing and TRPL involved. In subsequent calls, FWD performed excellent due to heavy caching, halving the times obtained in OE.
FwdJMX instrumentations, and after collecting data I obtained:
| Task | Code | Call Count | Time (ms) | Time/Call (ms) |
|---|---|---|---|---|
| Parsing of the ABL code string | parser.external_proc() |
10000 | 1154 | 0.115 |
| Adding annotations | runTask(ANNOTATIONS) |
1 | 1425 | 1425.000 |
| Base structrure | runTask(BASE_STRUCTURE) |
1 | 86 | 86.000 |
| Core Conversion | runTask(CORE_CONVERSION) |
1 | 1720 | 1720.000 |
| Post Process | processor.postprocessJavaAst(jCode) |
1 | 44 | 44.000 |
| Opening Query | interpreter.interpret("execute") |
30000 | 393 | 0.013 |
| Overall query processing | parse(...) |
30000 | 5419 | 0.187 |
The parsing is involved each time since all queries are different because of the way they are constructed. Actually, this is fast enough, but there are a lot of calls and the time sums up.
Notice that the TRPL tasks are invoked only once, because the DynamicQueryHelper is able to recognise that all these instances are identical, after extracting and matching the parameters and literals. There are some 600 ms spent in extra processing I did not add timer for, but the most time is spent while doing annotations (+1400ms) and the core conversion (+1700ms) in TRPL.
In order to have a better performance the TRPL must be greatly improved. I already had a look over the runtime-query rules from rules/convert/core_conversion.xml and rules/annotations/annotations.xml but this is quite difficult to analyse and optimise. I will continue focusing on this for a bit unless you have other ideas.
#19 Updated by Ovidiu Maxiniuc over 3 years ago
After previous note I changes the testcase a bit: I changed the second from the end line: message "Run " + string(k) + ":" dt1 "and" dt2. with:
   etime(true).
   i = 0.
   do while i lt N:
      create query hq.
      hq:set-buffers(buffer tt1:handle, buffer tt2:handle).
      hq:query-prepare("for each tt1, each tt2 where tt1.f1 = tt2.f2 and tt2.f2 = " + string(i)).
      hq:query-open().
      hq:query-close().
      delete object hq.
      i = i + 1.
   end.
   dt3 = etime.
Practically it is the same dynamic query, but with the inverted predicate so that, even if logically and the computation effort is the very same, the DynamicQueryHelper is not able to associate the two queries so the latter will have to be fully processed instead of grabbed from the cache. The result were:
| Native OE | FWD |
|---|---|
Run 1: 75 , 520 and 573 Run 2: 44 , 546 and 570 Run 3: 54 , 588 and 544 |
Run 1: 212 , 5943 and 2209 Run 2: 91 , 310 and 197 Run 3: 87 , 191 and 215 |
Notice that, for the static and the first dynamic query the time remained roughly the same (a little faster maybe), the first (cold) run of the second dynamic call has dropped at almost 1/3. The only explanation for this is that, in first instance FWD used 2/3 of time for compiling TRPL to native code.
Indeed, the JMX reported:
OrmDynQueryProcess_Parse (count/ms/ns):   20000 / 2106 / 2106055299
OrmDynQueryProcess_Annotation (count/ms/ns):  2 / 1286 / 1286317163
OrmDynQueryProcess_Base (count/ms/ns):        2 /   69 /   69970010
OrmDynQueryProcess_Core (count/ms/ns):        2 / 1649 / 1649308613
OrmDynQueryProcess_Post (count/ms/ns):        2 /   42 /   42977771
OrmDynParseQuery (count/ms/ns):           60000 / 7427 / 7427458239
OrmDynQueryInterpret (count/ms/ns):       60000 /  779 /  779988424
While the parsing scaled linearly, the Annotation, Core and the other TRPL tasks have the same (or even better) times. Indeed, dumping the JMX collected times for individual queries I can see the times dropping drastically: Annotation: (1318 to 24ms), Core: (1609 to 11ms), Base: (78 to 2ms). What remains relatively constant is the Parse procedure, with ~1000ms for 10K string instances.
#20 Updated by Ovidiu Maxiniuc over 3 years ago
Looking at the time results from #6813-18 it looks to me that the main slow-performance problem lies in the conversion of TRPL from xml to Java bytecode. Processing the first query requires this conversion. The times are 1318ms for Annotation and 1609ms for Core. The second query is also fully processed, but the TRPL is already available so times of 24ms and 11 ms respectively are the times effectively to run that code, which are acceptable, IMHO. This is also the difference between the 5943ms and 2209ms from the table. However, this is just a one-time operation of which all subsequent dynamic queries/finds will benefit.
However, even if second run is about 3 times faster that the first conversion, 2200ms is still 4x slower than OE counterpart. As noted above, of the 2209ms taken for the 2nd 10K-batch of queries, roughly half of it was spent in OrmDynQueryProcess_Parse (parser.external_proc(), DynamicQueryHelper:~399). Can we improve the ANTLR parsing process?
Probably I need to implement additional JMX timers for other pieces of code which are direct component of the conversion to have a better fine-tuned image of the time spent there (like preparing the lexer/parser with buffer data, creating keys and accessing the caches).
There is also an option to replace the dumb JavaAst used in conversion (slow because the annotations are put/extracted from maps) with some new ASTs which are aware of the specific runtime annotation. We talked about having them as fields with direct access (#6813-10). However, this will probably not help much here because they are used mainly by the RuntimeJastInterpreter. There is only one call for the initial setup which will counterbalance with rebuilding the tree with the new AST nodes.
#21 Updated by Greg Shah over 3 years ago
Looking at the time results from #6813-18 it looks to me that the main slow-performance problem lies in the conversion of TRPL from xml to Java bytecode. Processing the first query requires this conversion.
We could pre-compile all rules at server startup.
As noted above, of the 2209ms taken for the 2nd 10K-batch of queries, roughly half of it was spent in
OrmDynQueryProcess_Parse(parser.external_proc(),DynamicQueryHelper:~399). Can we improve the ANTLR parsing process?
If I recall correctly, we implement a small "program" wrapped around the dynamic query. There is a single DEFINE BUFFER and then there is a FIND or an OPEN QUERY. Is that right?
If so, then we can implement a replacement for the external_proc rule which is implemented specifically for dynamic queries. This would bypass lots of general purpose recognition logic and should certainly speed things up. We would just need the exact list of top-level statements which could be matched.
If the downstream rules are too general, we could even implement fast paths through there as well.
Probably I need to implement additional JMX timers for other pieces of code which are direct component of the conversion to have a better fine-tuned image of the time spent there (like preparing the lexer/parser with buffer data, creating keys and accessing the caches).
I think this is a good idea. I suspect that we should evaluate the SymbolResolver and especially the SchemaDictionary for their portions of the processing.
#22 Updated by Ovidiu Maxiniuc over 3 years ago
I added timers for the setup of SymbolResolver, SchemaDictionary and other tasks needed for the query-prepare and query-open methods.
| Operation | Time (ms) | Percent of total (%) |
|---|---|---|
| SymbolResolver setup | 406 | 8.87 |
| SchemaDict setup | 306 | 6.68 |
| Setup Parser/Parse | 2304 | 50.33 |
| TRPL Annotation | 54 | 1.25 |
| TRPL Base | 3 | 0.07 |
| TRPL Core | 24 | 0.56 |
| TRPL Post | 1 | 0.02 |
| Post Setup (prepare tree, extract params) |
327 | 7.57 |
| others/unknown | 24.22 | |
Query-Prepare (Parse) |
4578 | 100 |
Query-Open (Interpret) |
712 |
#23 Updated by Greg Shah over 3 years ago
Nice! Let's see what we can get back by implementing a new parser rule (dynamic_query) which is designed to do the minimum needed for dynamic query processing. We can set a parser-wide flag inside there and make downstream decisions off of it to save other time if we find expensive operations there that are not needed.
We will probaby also want to measure the add resources/lookup resources time in the SymbolResolver and SchemaDictionary. But that can be a next step.
#24 Updated by Ovidiu Maxiniuc over 3 years ago
dynamic_query entry point for parser. There are 3-4 statements which need to be supported:1. Dynamic find query:
| 1 . | FIND FIRST <buffer> <find-predicate> <lock-type> . |
| 2/3. | [ DEFINE BUFFER <buff-name> FOR [ TEMP-TABLE ] <table-name> . ]* |
| 4. | OPEN QUERY "DynGenQuery" <query-predicate> . |
They must be grouped in a block / single_block / stmt_list to benefit from natural processing downstream. I debugged the current flow and the parser reaches those really quick; I do not expect a couple of chain calls to make much of a difference.
The SymbolResolver seems to be already optimized: in case of runtime, much data is not loaded. Same stands for SchemaDictionary.
I think there are other source of improvements in TRPL. One I can guess now are usages of downPath and upPath which, in some conditions may be replaced with type checks of the ancestors. I estimate this is clearly faster than splitting a string and interpreting each token.
#25 Updated by Greg Shah over 3 years ago
They must be grouped in a block / single_block / stmt_list to benefit from natural processing downstream. I debugged the current flow and the parser reaches those really quick; I do not expect a couple of chain calls to make much of a difference.
I understand. Even though it is possibly not much improvement, it still must be something small which we can get back. It is safe and easy to do, so let's get that back.
#26 Updated by Greg Shah over 3 years ago
I think there are other source of improvements in TRPL. One I can guess now are usages of
downPathandupPathwhich, in some conditions may be replaced with type checks of the ancestors. I estimate this is clearly faster than splitting a string and interpreting each token.
I like this idea.
#27 Updated by Eric Faulhaber over 3 years ago
Greg Shah wrote:
I think there are other source of improvements in TRPL. One I can guess now are usages of
downPathandupPathwhich, in some conditions may be replaced with type checks of the ancestors. I estimate this is clearly faster than splitting a string and interpreting each token.I like this idea.
It seems downPath and upPath could be implemented with a varargs parameter of token types (e.g., upPath(int... tokenTypes)), and that should be much faster than string manipulation. For example, replace calls like:
upPath("STATEMENT/KW_FIND/RECORD_PHRASE")
with:
upPath(prog.statement, prog.kw_find, prog.record_phrase)
That should make the replacement TRPL code simpler and more compact.
#28 Updated by Ovidiu Maxiniuc over 3 years ago
Greg Shah wrote:
They must be grouped in a block / single_block / stmt_list to benefit from natural processing downstream. I debugged the current flow and the parser reaches those really quick; I do not expect a couple of chain calls to make much of a difference.
I understand. Even though it is possibly not much improvement, it still must be something small which we can get back. It is safe and easy to do, so let's get that back.
Indeed, ANTLT generates the main's switch default selector in stmt_list method as a cascade of if-s. This is not optimal and I guess occurrences like these would help increase performance.
Eric Faulhaber wrote:
Greg Shah wrote:
I like this idea.
It seems
downPathandupPathcould be implemented with a varargs parameter of token types (e.g.,upPath(int... tokenTypes)), and that should be much faster than string manipulation. For example, replace calls like:
[...]
That should make the replacement TRPL code simpler and more compact.
Yes, close to the compactness of initial code. But the effort for parsing is one-time, at TRPL compilation time as opposed to current solution when the string is parsed at each access.
However, if we replace all occurrences of downPath and upPath the change-set is enormous (I was able to count 200+ hundreds of occurrences). I will try to do this automatically, if possible.
#29 Updated by Ovidiu Maxiniuc over 3 years ago
Greg Shah wrote:
I understand. Even though it is possibly not much improvement, it still must be something small which we can get back. It is safe and easy to do, so let's get that back.
I finished and cleanup the ANTLR rules and Java code to use the new parser methods. The timer for parsing shows now:
OrmDynQueryProcess_Parse2: 20000 / 1991This is about 5.4% better for this task.
I committed the update as r14360/6129b.
Greg, please review the changes in progress.g. Thank you!
#30 Updated by Ovidiu Maxiniuc over 3 years ago
Ovidiu Maxiniuc wrote:
Eric Faulhaber wrote:
That should make the replacement TRPL code simpler and more compact.
Yes, close to the compactness of initial code. But the effort for parsing is one-time, at TRPL compilation time as opposed to current solution when the string is parsed at each access.
However, if we replace all occurrences ofdownPathandupPaththe change-set is enormous (I was able to count 200+ hundreds of occurrences). I will try to do this automatically, if possible.
I have started implementing the new downPath and upPath and did a quick smoke-test. There seems to be an issue with the TRPL compiler and vararg methods. I added the method public boolean upPath(Integer... path); and added a piece of code to test:
         <rule>target.upPath("DEFINE_TEMP_TABLE/KW_TEMP_TAB")           or
               target.upPath(prog.define_temp_table, prog.kw_temp_tab)
            [...]
It fails when running the conversion with:
No function resolved for instance (com.goldencode.ast.Aast getVar(int) @class com.goldencode.expr.CompiledExpression) and method (name == upPath, signature == ([int, int]))
I tried using Integer[] path, Object... path and Object[] path as signatures for upPath() and it fails each time with same error. The only acceptable for is upPath(int, int), which is not very useful.
#31 Updated by Constantin Asofiei over 3 years ago
varargs in TRPL are emulated via Object[] I think - see CommonAstSupport.getAncestorOfType for an example.
#32 Updated by Eric Faulhaber over 3 years ago
Ovidiu, did you get the varargs working? If it doesn't work directly with Aast, try it with CommonAstSupport, as Constantin suggests.
#33 Updated by Ovidiu Maxiniuc over 3 years ago
Eric Faulhaber wrote:
Ovidiu, did you get the varargs working? If it doesn't work directly with
Aast, try it withCommonAstSupport, as Constantin suggests.
Unfortunately, it does not work. The method [ExtraAst ast] from expression.g gather the types of all parameters to form a signature using generateSignature(). However, the support is limited here. Only the method with the exact list of parameters are accepted, otherwise "No function resolved for instance..." error is thrown (expression.g:1313).
I have already started to make changes for re-routing these calls through CommonAstSupport which seems to have different implementation for resolving parameters and vararg in particular.
Also I need to make sure the semantics of the new methods are the same.
#34 Updated by Ovidiu Maxiniuc over 3 years ago
I have created branch 6813a and committed revision 14363.
It is not final.
The Java support should be done (I left some scaffolding in there) but the TRPL is not fully updated. In fact, only the relativePath() were replaced. The other will be done tomorrow. There are a lot of occurrences to update and tested :(. The good part is that the constants are parsed when the conversion runs thus avoiding incorrect paths.
#35 Updated by Constantin Asofiei over 3 years ago
Ovidiu Maxiniuc wrote:
The Java support should be done (I left some scaffolding in there) but the TRPL is not fully updated. In fact, only the
relativePath()were replaced.
When you have a working version of relativePath(), please commit to 6129b. relativePath() is what shows up in the profiler.
#36 Updated by Ovidiu Maxiniuc over 3 years ago
Constantin,
I started with relativePath() since I counted the most occurrences in rules/ folder. It make sense that they are also one of the most used. The 6813a/14363 revision has all relativePath() upgraded. You can try to run the profiler on it. The implementation of the new methods was done with self-testing (the methods were executed in both String and Integer token array and in case of difference the conversion reported the issue). I run it on small projects (no OO involved); everything seemed clean so the risk is low.
However, it is a couple of revisions behind, as I had no time to rebase it first. I will do that later today with hopefully all other related methods implemented (upPath(), downPath(), absolutePath()). I will let you know when final revision is ready and committed to 6129b.
#37 Updated by Ovidiu Maxiniuc over 3 years ago
A new set of changes were committed to 6813a (r14364).
It seems that they never end :(. My IDE stops counting at 100+ occurrences. The vast majority of the changes are for the downPath() method. There are hundreds of places where a simple child is searched. Although the new method should be much faster than previous, I wonder whether the getImmediateChild(type) is a better (faster) choice in these places.
#38 Updated by Constantin Asofiei over 3 years ago
Ovidiu Maxiniuc wrote:
It seems that they never end :(. My IDE stops counting at 100+ occurrences. The vast majority of the changes are for the
downPath()method. There are hundreds of places where a simple child is searched.
There are 688 x downPath, 409 x upPath, and 288 x relativePath occurrences in 6129b.
#39 Updated by Greg Shah over 3 years ago
Code Review Task Branch 6129b Revision 14360
The DynamicConversionHelper and DynamicQueryHelper need history entries, but otherwise I see no obvious issues.
#40 Updated by Eric Faulhaber over 3 years ago
Constantin Asofiei wrote:
Ovidiu Maxiniuc wrote:
It seems that they never end :(. My IDE stops counting at 100+ occurrences. The vast majority of the changes are for the
downPath()method. There are hundreds of places where a simple child is searched.There are 688 x downPath, 409 x upPath, and 288 x relativePath occurrences in 6129b.
Ovidiu, while we ultimately want to address all of these to make conversion faster, the immediate goal is to address the instances that affect runtime conversion specifically. So, please scope your current effort to only those rule-sets, if you are not doing this already.
#41 Updated by Ovidiu Maxiniuc over 3 years ago
Committed r14365 of 6813a. All occurrences have been processed and upgraded, including those from Java code and progress.g.
upPath("DEFINE_BROWSE/KW_DISP/KW_WITH/TITLE_PHRASE"): TheTITLE_PHRASEdoes not exist (any more?).- 100 points question: what does the following TRPL code:
            <variable name="nullPtr" type="com.goldencode.ast.Aast" />
            <action>nullPtr = null</action>
            <rule>(nullPtr.id == 0 and (3 == 1))
               <action on="false">printfln("is null!!!!")</action>
            </rule>
I spent a lot of time hunting a bug in my new code which causes the conversion to behave incorrectly and even crash. The old code was accessingupPath()of anullvariable. Because I changed this to use theCommonAstSupport, the bug surfaced.
I will investigate in-depth later tomorrow/today, but it looks to me like out JIT is not working correctly. Instead of throwing NPE, it evaluates the other operand of theandor even worse, assume NPE equivalent tofalse- the result is the same if we replace3==1with3==3.
The piece of code where this happens is the function oo_call_type from rules/include/common-progress.rules. If chref == null and the first 3 or-clauses are false, it will attempt to compute upPath() for the null parameter.
#42 Updated by Greg Shah over 3 years ago
I will investigate in-depth later tomorrow/today, but it looks to me like out JIT is not working correctly. Instead of throwing NPE, it evaluates the other operand of the and or even worse, assume NPE equivalent to false - the result is the same if we replace 3==1 with 3==3.
I think this is a consequence of a "feature" in TRPL, which is designed to avoid NPE in certain cases. I think the operators are "NPE safe" right now. I agree it is confusing, hard to reason about and it is not implemented everywhere. This means you can still get lots of NPEs, just not in certain places.
#43 Updated by Ovidiu Maxiniuc over 3 years ago
I understand. What is the appropriate action to do when node is null when replacing:
node.upPath("a/b/c") and evalLib("f")with upPath(node, prog.a, prog.b, prog.c) and evalLib("f")?
Since node is null, the original code will evaluate to false without throwing NPE. The upPath now will execute the new CommonAstSupport.upPath(AstNode n, Object[] path). Is it logical to just return false when the first parameter is null without any knowledge of the value of the expression evalLib("f")?
I am thinking of letting NPE being thrown, and make sure in TRPL that the node is NOT null. This will require some additional changes in TRPL code for testing the Ast parameter before the invocation of upPath (and similar methods).
Both cases are acceptable, but in either case we MUST document the behaviour of the new methods.
#44 Updated by Greg Shah over 3 years ago
Since node is null, the original code will evaluate to false without throwing NPE. The upPath now will execute the new CommonAstSupport.upPath(AstNode n, Object[] path). Is it logical to just return false when the first parameter is null without any knowledge of the value of the expression evalLib("f")?
This has the advantage of being compatible with current rules. I'm not against the NPE idea but I don't want to spend weeks of time tracking these down.
#45 Updated by Eric Faulhaber over 3 years ago
Ovidiu Maxiniuc wrote:
Since
nodeisnull, the original code will evaluate tofalsewithout throwing NPE.
BTW, the weirdness you are seeing is documented here: Writing TRPL Expressions.
#46 Updated by Ovidiu Maxiniuc over 3 years ago
Sorry, I was not aware of this Automatic Null Checking feature. My bad. I experimented the exact situation referred there: switching from a null object as target to a null parameter. In later case the TRPL compiler will let the called method decide whether to throw the NPE or not.
However, I think I will let NPE being thrown in this case. I encountered a single instance of such event in my conversions and I will transform the expression to avoid this case. If it happened to me, the chances are other developers might encounter the same issue. My brain have been trained to always check for null objects before accessing them. Swallowing the NPE is counter-intuitive and I strongly disagree with it. As Greg mentioned, this may cause unexpected behaviour and I already spent about a day investigating why in my new code the variable was null when, apparently, in original code it was not. The respective variable could be incorrectly initialized anywhere in TRPL due to my changes, but also the other variables which could have prevented the respective line to be evaluated. It turned out the code was fine, the variable was null with both revisions but a semantically difference.
A NPE, OTOH, will immediately pinpoint to the source of the error.
PS: I am aware that other programming languages (Kotlin, C#) have "safe calls" operators which do the same (in conjunction with nullable types), but it is not widely used, only in simpler expressions and the operator is present to inform the reader of the event that it is a safe call:
val x: String? = null
println(x?.length)
#47 Updated by Constantin Asofiei over 3 years ago
Ovidiu Maxiniuc wrote:
A NPE, OTOH, will immediately pinpoint to the source of the error.
Ovidiu, we need this in 6129b - we can't track and fix every NPE these changes may introduce, at this time. Instead, just return false if the AST is null, and maybe log a message with the names in the token array used for lookup.
#48 Updated by Constantin Asofiei over 3 years ago
Constantin Asofiei wrote:
Ovidiu Maxiniuc wrote:
A NPE, OTOH, will immediately pinpoint to the source of the error.
Ovidiu, we need this in 6129b - we can't track and fix every NPE these changes may introduce, at this time. Instead, just return
falseif the AST is null, and maybe log a message with the names in the token array used for lookup.
Please make sure that the branch is rebased on latest 6129b, so I can test the customer's runtime, before we'll do conversion testing - we need to do this before merging it into 6129b.
#49 Updated by Ovidiu Maxiniuc over 3 years ago
I have done the final clean-up and local tests and then rebased from 6129b and pushed to ../p2j/active/6813a/. The latest revision is 14380.
| Native OE | Original FWD trunk/14480 |
Custom Parser 6129b/14360 |
New path methods 6813a/14380 |
|---|---|---|---|
Run 1: 75 , 520 and 573 Run 2: 44 , 546 and 570 Run 3: 54 , 588 and 544 |
Run 1: 212 , 5943 and 2209 Run 2: 91 , 310 and 197 Run 3: 87 , 191 and 215 |
Run 1: 210 , 3057* and 2103 Run 2: 85 , 294 and 205 Run 3: 59 , 188 and 201 |
Run 1: 210 , 2928* and 1957 Run 2: 79 , 308 and 238 Run 3: 62 , 151 and 168 |
* this tests do not contain the warm-up run, which is an execution of single dynamic query independently, before the loop in 4GL procedure.
LE: I do not know why, the first run on warm cache is slightly slower (~300/200 ms). However, as the number of runs increases, the averages are quite close to 3rd run. This is why I added the 3rd run and also considered it as representative for a longer series of tests.
Comparing to previous runs a new small increase in performance can be visible, maybe 10%. However, the tests are targetted at the specific features so overall the gain might not be visible with the naked eye.
#50 Updated by Constantin Asofiei over 3 years ago
Ovidiu, did you meant to rebase 6813a on top of 7020a? See commits 14375 and 14376
#51 Updated by Constantin Asofiei over 3 years ago
Constantin Asofiei wrote:
Ovidiu, did you meant to rebase 6813a on top of 7020a? See commits 14375 and 14376
I can't test 6813a with a customer's app because it abends from the 7020a commits.
#52 Updated by Greg Shah over 3 years ago
I suspect there is still some significant improvement that can be made to the performance. The core parsing might be quite fast overall, but we will certainly be processing a wider range of logic than is needed.
For example, the lvalue rule will be doing constant lookups of a wide range of possible matches while the actual possibilities are probably just the various field types. In other words, you can't directly reference variables, handle-based methods/attributes, OO methods/attributes... right? So the lookups of these other things are wasted time. I doubt OE spends any time on considering such matches.
Likewise, we already know the list of buffers which can possibly be referenced, right? So we can further optimize the SchemaDictionary lookups to only check the tables associated with those buffers. Again, the SchemaDictionary lookups may be fast in general but OE probably doesn't do this extra work, why should we?
#53 Updated by Greg Shah over 3 years ago
I have another idea, which I think should be a "game changer". Let's write out the generated classes (and any critical query/table "meta-info") to the file system so that our cache of dynamic queries persists across server restarts. At some point we might have a cache built up that eliminates some substantial portion of the dynamic generation overhead. If I understand Ovidiu's results above, our raw query execution is actually better than the OpenEdge result, but it is the cost of our dynamic generation where it kills us.
Doing this seems pretty straight forward. If we have high cache hit levels, then we should see a major benefit.
#54 Updated by Ovidiu Maxiniuc over 3 years ago
Greg Shah wrote:
I have another idea, which I think should be a "game changer". Let's write out the generated classes (and any critical query/table "meta-info") to the file system so that our cache of dynamic queries persists across server restarts.
This is a deja-vu for me. But I do not remember if we talked about this exact case or anything else (like the SAVE-CACHE implementation, #6371). Nonetheless, the result of the dynamic processing can be saved to a fast disk (it would be a .jast, not actually a .class file) but it needs to be saved mapped by its keys used in both cache implementations. To avoid loading the full history I would use a lazy read (grab it from disk only on first access) so that the in-memory cache would contain both old and new items at the same time. My problems here are the keys, and particularly the buffers. They are rather volatile, they can have parent table permanent but also static and dynamic temp-tables. Then there are the default values for the constant which were replaced by substitutions. I thought saving the data in a file, into a specific directory, with the key/s as filename, but this does not seem feasible to me. Maybe to a H2 database instead?
At some point we might have a cache built up that eliminates some substantial portion of the dynamic generation overhead. If I understand Ovidiu's results above, our raw query execution is actually better than the OpenEdge result, but it is the cost of our dynamic generation where it kills us.
Yes, the 4GL code is the same. But FWD uses heavy caching and an intelligent algorithm to match similar queries. Probably, OE does the full parsing each time.
Doing this seems pretty straight forward. If we have high cache hit levels, then we should see a major benefit.
Yes, I can try to create a PoC of the above and see the performance in FWD while running the same testcase.
#55 Updated by Ovidiu Maxiniuc over 3 years ago
Greg Shah wrote:
I suspect there is still some significant improvement that can be made to the performance. The core parsing might be quite fast overall, but we will certainly be processing a wider range of logic than is needed.
For example, the
lvaluerule will be doing constant lookups of a wide range of possible matches while the actual possibilities are probably just the various field types. In other words, you can't directly reference variables, handle-based methods/attributes, OO methods/attributes... right? So the lookups of these other things are wasted time. I doubt OE spends any time on considering such matches.
We trim some of the rules using load-condition="runtime-query" but, of course, there is room for improvements.
Likewise, we already know the list of buffers which can possibly be referenced, right? So we can further optimize the
SchemaDictionarylookups to only check the tables associated with those buffers. Again, theSchemaDictionarylookups may be fast in general but OE probably doesn't do this extra work, why should we?
I agree.
#56 Updated by Greg Shah over 3 years ago
In regard to writing things to disk for persistence between server runs, we could write the generated DMOs (bytecode) to disk as well for the dynamic temp-tables.
#57 Updated by Greg Shah over 3 years ago
For example, the
lvaluerule will be doing constant lookups of a wide range of possible matches while the actual possibilities are probably just the various field types. In other words, you can't directly reference variables, handle-based methods/attributes, OO methods/attributes... right? So the lookups of these other things are wasted time. I doubt OE spends any time on considering such matches.We trim some of the rules using
load-condition="runtime-query"but, of course, there is room for improvements.
On this one, I was referring to the parser "rules" instead of TRPL rules. In this example, for the lvalue rule of the parser, only small set of possible matches can occur.
#58 Updated by Constantin Asofiei over 3 years ago
Another point related to #6813-9 with query predicates which differ just with inlined literals. After the predicate is parsed, we can compute a unique key from this AST, excluding any literal. If there is an already TRPL-processed AST which matches, we can just use that AST to inject the literals and evaluate it. The literal positions can be kept as a path from the root, including the node type and its index in the next level. This will avoid the TRPL overhead for re-processing basically the same AST.
#59 Updated by Ovidiu Maxiniuc over 3 years ago
Constantin, we are already doing this. After the query is parsed, the constants are extracted as variables. Each time the query is matched in cache, the respective variables are updated in the substitutions vector before being interpreted. This is preferred instead of re-hardcoding the new values since the SQL is probably cached also as a prepared statement on the server, which improves out-of-process performance too.
#60 Updated by Constantin Asofiei over 3 years ago
Thanks, I was thinking of something else and I recalled in the wrong way; in a customer app, buffer names are generated randomly. So, even if two predicates are syntactically the same, FWD will not identify them as identical. See this example:
def temp-table tt1 field f1 as char.
def buffer bb1 for tt1.

def var hq as handle.
create query hq.
hq:add-buffer(buffer tt1:handle).
hq:query-prepare("for each tt1 where tt1.f1 = 'abcd'").
hq:query-open().
delete object hq.

create query hq.
hq:add-buffer(buffer bb1:handle).
hq:query-prepare("for each bb1 where bb1.f1 = '12345'").
hq:query-open().
delete object hq.
#61 Updated by Ovidiu Maxiniuc about 3 years ago
The example is good, I understand what you mean: the problem are not the literals, but the fact that different buffers are associated with the same table.
However, this is meant by design. The (references to) buffers are hardcoded in the JAST tree which is dynamically interpreted. The buffer references are set as runtime annotation in that tree. So the full set of buffers used by such query is part of the cache key.
If we are going to reuse the trees for different queries, as in the testcase above, we need to replace (or invalidate at least) all references to buffer objects AND make sure the previous dynamic queries DO NOT use the respective tree any more. If a previous query still refer a dynamic query and it is closed/reopened after the JAST tree was recycled the result will be incorrect and difficult to detect/debug.
#62 Updated by Constantin Asofiei about 3 years ago
Ovidiu, what is the state of the 6813a branch? I'd like to complete this.
#63 Updated by Constantin Asofiei about 3 years ago
- Assignee changed from Ovidiu Maxiniuc to Constantin Asofiei
#64 Updated by Constantin Asofiei about 3 years ago
I'm counting the arguments for the relativePath, upPath and downPath from rules/; the result is this:
Count   Arg. num.
    306 1
    485 2
    320 3
    148 4
     19 5
      4 6
      1 7
We have the majority of calls with 1, 2 3 or 4 arguments. Currently the expr.Compiler doesn't support method overload resolution via varargs. But this change in expr.SymbolResolver.matchTargetMethod
      while (iter.hasNext())
      {
         Function next = (Function) iter.next();
         if (next.matchSignature(signature, strict))
         {
            if (func != null)
            {
               // if the next target is on a non-vararg method, and the previous found target is a vararg, then
               // use the non-vararg method.

               // if the next target is a vararg method, then do nothing, keep the previous match
               if (!next.isVarArg())
               {
                  if (func.isVarArg())
                  {
                     func = next;
                  }
                  else
                  {
                     // Can't tell which one is the real match...
                     throw new AmbiguousSymbolException(target.getName() + "." + name);
                  }
               }
            }
            else
            {
               func = next;
            }
         }
      }
while previously was:
      while (iter.hasNext())
      {
         Function next = (Function) iter.next();
         if (next.matchSignature(signature, strict))
         {
            if (func != null)
            {
               // Can't tell which one is the real match...
               throw new AmbiguousSymbolException(
                  target.getName() + "." + name);
            }
            func = next;
         }
      }
Seems to solve the issue. Function.isVarArg() just checks if the last parameter from the method definition is an array. The point of the change is this: if we find a match which is not vararg, then this has priority over the vararg match.
Greg, do you see any issue with this? The point here is to avoid creating the Object[] array associated with the vararg, for each call.
#65 Updated by Constantin Asofiei about 3 years ago
As an addendum: the point of this change is to have method definition for i.e. upPath with 1, 2, 3 and 4 arguments. The vararg will remain only for special cases.
#66 Updated by Greg Shah about 3 years ago
I think the change is OK. I had to read it a few times, but your comments helped.
#67 Updated by Constantin Asofiei about 3 years ago
I've used this to validate the tokens used in upPath, relativePath, downPath and absolutePath (btw, this is not used in TRPL):
# while in the "rules" folder
cd rules

# find all lines with these API calls
grep -Eir "absolutePath|relativePath|downPath|relativePath|upPath" . | grep "prog." | cut -d':' -f 2- | sed  's/\(absolutePath\|relativePath\|downPath\|upPath\)/@/g' | while read f; do echo $f | tr "@" "\n"  ; done | grep "prog." | cut -d'(' -f 2- | cut -d')' -f 1  > a.txt

# split all arguments on their own line; b.err must be empty
cat a.txt | while read f; do echo $f | tr "," "\n"  ; done 2> b.err > b.txt

# check if the token type is defined in ProgressParserTokenTypes.java
cat b.txt | sed 's/^ *//;s/ *$//' | grep "prog." | sort  | uniq | cut -d'.' -f 2 | while read f; do echo $f ; grep -iHn "int $f = " ../src/com/goldencode/p2j/uast/ProgressParserTokenTypes.java  ; done > c.txt

# the number of tokens and 'findings' in c.txt must be the same (there is some garbage in c.txt which needs to be removed first)
cat c.txt | grep -Ev "/src/" | wc -l
cat c.txt | grep "/src/" | wc -l
#68 Updated by Ovidiu Maxiniuc about 3 years ago
Constantin Asofiei wrote:
Ovidiu, what is the state of the 6813a branch? I'd like to complete this.
6813a was built on top of 7020a which was created on top of the old 6129b. Now it is in a frozen state. I was not able to do the rebase: I cannot do it locally and, even if I could, the changes are too many for me to fully handle them (I recall you needed 2 or two days to rebase that branch before merging it to trunk).
#69 Updated by Constantin Asofiei about 3 years ago
6813a was dead-archived. 6813b was created from trunk rev 14563.
I've fixed the conflicts and all changes are in a single commit, rev 14564. This includes the #6813-64 patch and the 1 to 4 arg versions of upPath, relativePath, downPath.
I have 3 more apps which need to be fully converted (btw, FWD trunk has a conversion regression for open client proxy generation - the fix is in 6813b), but it looks promising. I don't have an exact comparison of the time it took to convert an app (as I had 6 conversion in parallel), but from the looks of it even conversion has ~10% improvement (I'll need Eugenie/Roger to confirm this when they convert the apps on their machine).
What is left is to do a code cleanup. Once I do this, Ovidiu, I'd like for you to review the src/ changes; there is some commented code in some files (for debugging/validating changes) - do you want to keep this? I'll take care of reviewing rules/ changes.
As a side note, the deprecated String argument of these APIs will still remain, as we have customer pattern rules which would need to be changed if we drop these.
#70 Updated by Constantin Asofiei about 3 years ago
6813b rev 14565 fixes history numbers, some javadocs and also adds the CommonAstSupport versions of upPath/downPath/relativePath with 1 to 4 token parameters. I'm reconverting again... I forgot about finishing these last night, had only 1 to 3 tokens for CommonAstSupport.upPath.
Ovidiu: please review all the src/ changes, and remove any commented code which you think is no longer needed.
Beside conversion, I'll need to test some data import, too.
#71 Updated by Constantin Asofiei about 3 years ago
6813b rev 14566 fixes what I think is a debug added in common-progress.rules:oo_call_type function, there was a prog.eof added at the end of the path.
#72 Updated by Constantin Asofiei about 3 years ago
6813b rev 14567 fixes another typo.
I've reviewed rules/ changes (95% automatically, 5% manually). Considering that conversion is OK until now, what's left is for another large app to finish conversion and test it. And Ovidiu's review for src/ changes.
Also, ETF runtime testing passed.
#73 Updated by Ovidiu Maxiniuc about 3 years ago
SymbolResolver.java,matchTargetMethod()method. There is another case of ambiguity when there are two candidates detected: if two vararg methods are matching the signature. However, this should not happen since we do not have such methods defined. But in the future, the ambiguity might be created by adding new vararg methods.CommonAstSupport.java- cleaned up. I added deprecation log messages in case somebody will attempt to use the old APIs. I also kept the old string-based implementation to defer themeth(String)calls. Yet, I am thinking of re-wiring them to the new varargs implementation and drop support for old string-based implementations. Please review my changes here (r14568).
#74 Updated by Constantin Asofiei about 3 years ago
Ovidiu, I understand your reasoning about the deprecated String APIs, but please remove System.out.println("Deprecated API: - there are customer pattern rules which may use these, and will just add unnecessary clutter until we refactor these. More, this should use a logger and not just System.out.println.
#75 Updated by Constantin Asofiei about 3 years ago
I've removed the System.out.println("Deprecated API: calls in 6813b rev 14569.
Greg: this can be merged to trunk.
#76 Updated by Greg Shah about 3 years ago
6813b can be merged to trunk now.
#77 Updated by Constantin Asofiei about 3 years ago
Greg Shah wrote:
6813b can be merged to trunk now.
OK, working on it.
#78 Updated by Constantin Asofiei about 3 years ago
6813b/14569 was rebased from trunk rev 14570 - new rev 14576.
6813b/14576 was merged to trunk rev 14571 and archived.
#79 Updated by Constantin Asofiei about 3 years ago
- avoid recursion in
AnnotatedAst.duplicate - in
goldencode.expr, move the scope state from theSymbolResolverto theScopeinstance. There is a catch here: aScopecan be associated with multipleSymbolResolverinstances. I think this was the reason why this state was kept at the resolver. I noticed this behavior only at FWD runtime, some security state. But, for conversion, we only have a single instance - so, these changes use a 'singleton' mode until another resolver instance wants to use the same scope. After that, it switches to multi-resolver behavior. This seems to solve both cases, while avoiding the WeakHashMap cost.
These changes show a ~3% improvement when converting a small app. But, this was seen in profiling dynamic query conversion.
Greg, the changes are in rev 14584. Please do a review, I know I haven't clean them app or added javadoc. I also don't know what to do about SymbolResolver.dumpVariablePool.
#80 Updated by Greg Shah about 3 years ago
Code Review Task Branch 6813c Revision 14584
It's good.
#81 Updated by Greg Shah about 3 years ago
Are you still trying to get 6813c into trunk?
#82 Updated by Constantin Asofiei about 3 years ago
Greg Shah wrote:
Are you still trying to get 6813c into trunk?
Not yet, next week probably.
#83 Updated by Constantin Asofiei about 3 years ago
Greg, another thought, which probably should be in its own task: it takes ~1.3 seconds to load a 90MB .ast file on my machine, 54% of the time spent in XmlHelper.parse. XmlFilePlugin.loadTree relies on DOM, which is slow on its own. Maybe we should consider to use StAX/XmlStreamReader for reading, and XmlStreamWriter for writing, in XmlFilePlugin?
A simple code using XmlStreamReader to just read the 90MB .ast file takes ~35% less than XmlHelper.parse. For the file above, it would be ~16% improvement in XmlFilePlugin.loadTree. With some napkin math, in an app we have 130GB of .ast files, which get fully processed I think 10 times? With 1.3s per 90MB, this gives 0.5 hours for just .ast loading, and it would be ~5hours just for this processing, over the full conversion. This does not include the DOM creation for writing, which can improve things further.
#84 Updated by Constantin Asofiei about 3 years ago
Constantin Asofiei wrote:
A simple code using
XmlStreamReaderto just read the 90MB .ast file takes ~35% less thanXmlHelper.parse. For the file above, it would be ~16% improvement inXmlFilePlugin.loadTree. With some napkin math, in an app we have 130GB of .ast files, which get fully processed I think 10 times? With 1.3s per 90MB, this gives 0.5 hours for just .ast loading, and it would be ~5hours just for this processing, over the full conversion. This does not include the DOM creation for writing, which can improve things further.
With a ~16% improvement, this would result in ~50minutes improvement for XmlFilePlugin.loadTree over this 130GB .ast files, for the entire conversion. It doesn't look much overall, but it may be worth it when we add the heap cost, too.
#85 Updated by Greg Shah about 3 years ago
I agree this is a good idea. Please open a task for it.
#86 Updated by Constantin Asofiei about 3 years ago
#87 Updated by Greg Shah about 3 years ago
- Related to Feature #7390: replace DOM with StAX in XmlFilePlugin added
#88 Updated by Constantin Asofiei about 3 years ago
Greg Shah wrote:
Are you still trying to get 6813c into trunk?
I've made the cleanup changes and rebased from trunk 14592 - new rev 6813c 14595.
#89 Updated by Greg Shah about 3 years ago
You can merge to trunk.
#90 Updated by Constantin Asofiei about 3 years ago
6813c was merged to trunk rev 14596 and archived.
#91 Updated by Eric Faulhaber about 3 years ago
What is left to do on this task? Can we update the % done to a value that reflects the true status?
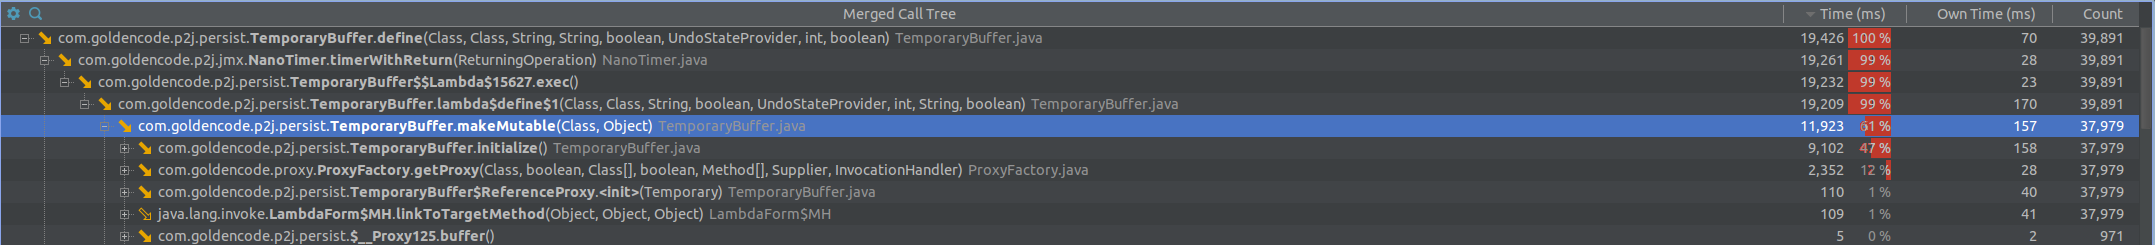
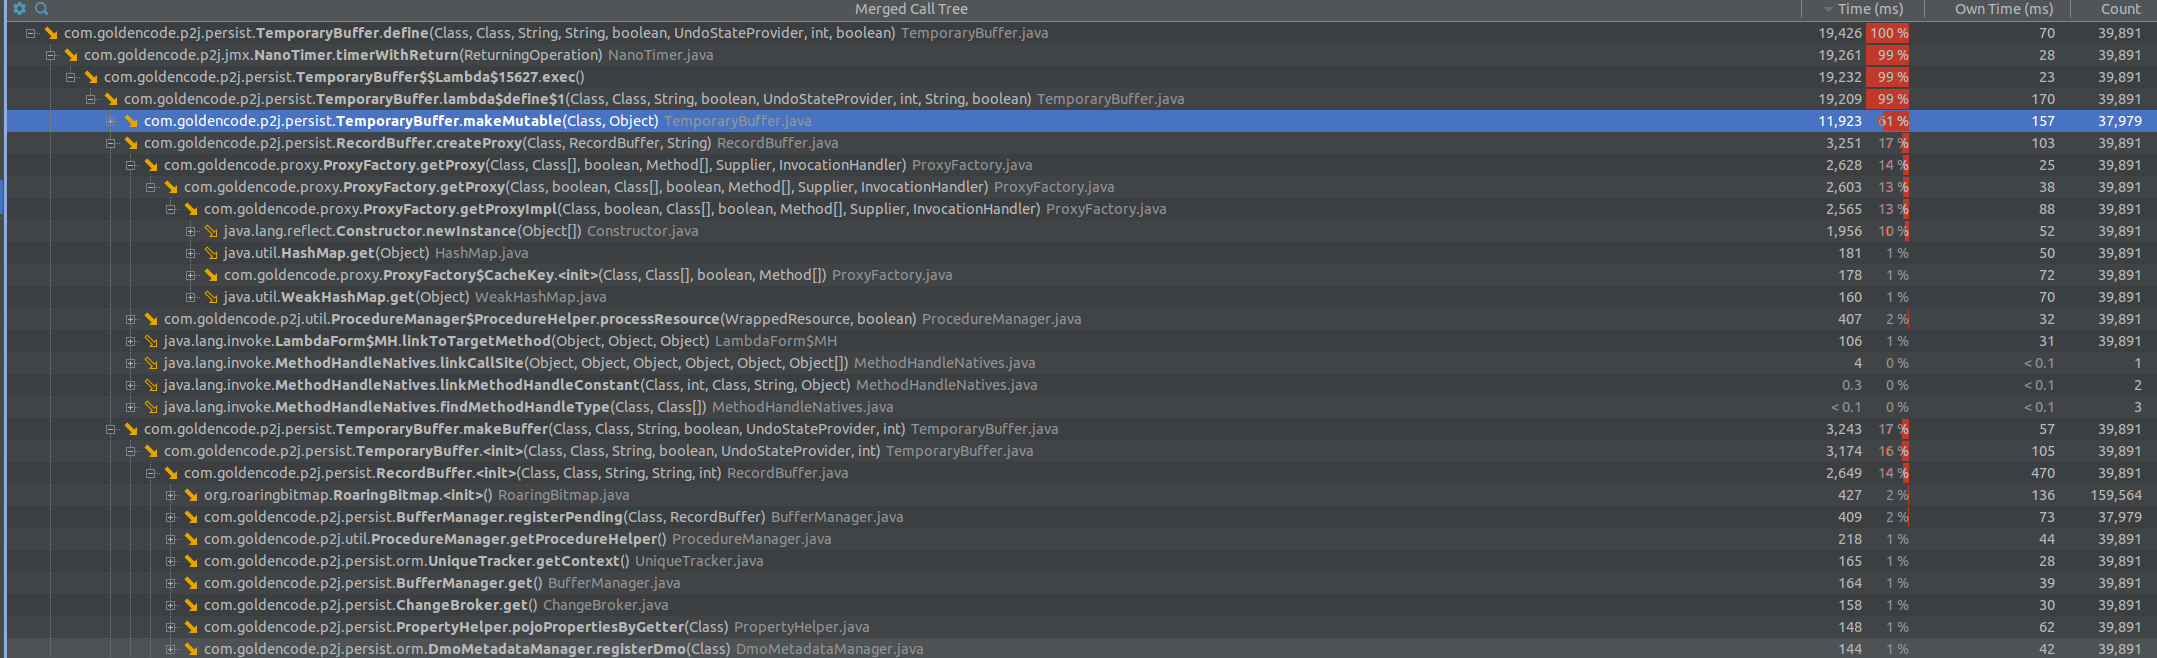
#92 Updated by Constantin Asofiei almost 3 years ago
- File tt_define_1.png added
- File tt_define_2.png added
- % Done changed from 0 to 80
Eric Faulhaber wrote:
What is left to do on this task? Can we update the % done to a value that reflects the true status?
These are some metrics from profiling a large application; this is still high, but I'm not sure what else can be reduced. I have some changes related to #4032 which will affect this (StaticTempTable instantiation), and I'll do some more profiling after that.